The Ticking Clock of Inventory Aging
Inventory aging is the silent margin killer in used vehicle operations. Average daily holding costs range from $37 to $85 per vehicle depending on the operation — and the average used vehicle gross profit hit $1,668 per unit in Q2 2025, with margins compressed to 5.4% (down from 7.3% in 2019). Every day a vehicle sits unsold, inventory aging costs consume the margin that sale is supposed to generate.
At $40/day in holding costs, a vehicle held for 42 days — close to the industry average days-to-sale — absorbs $1,680 before it ever sells. That single figure exceeds the average gross profit. Dealers who treat pricing as a static decision made once at acquisition lose money on aged inventory. Dealers who treat pricing as a dynamic process tied to a depreciation timeline protect their margin.
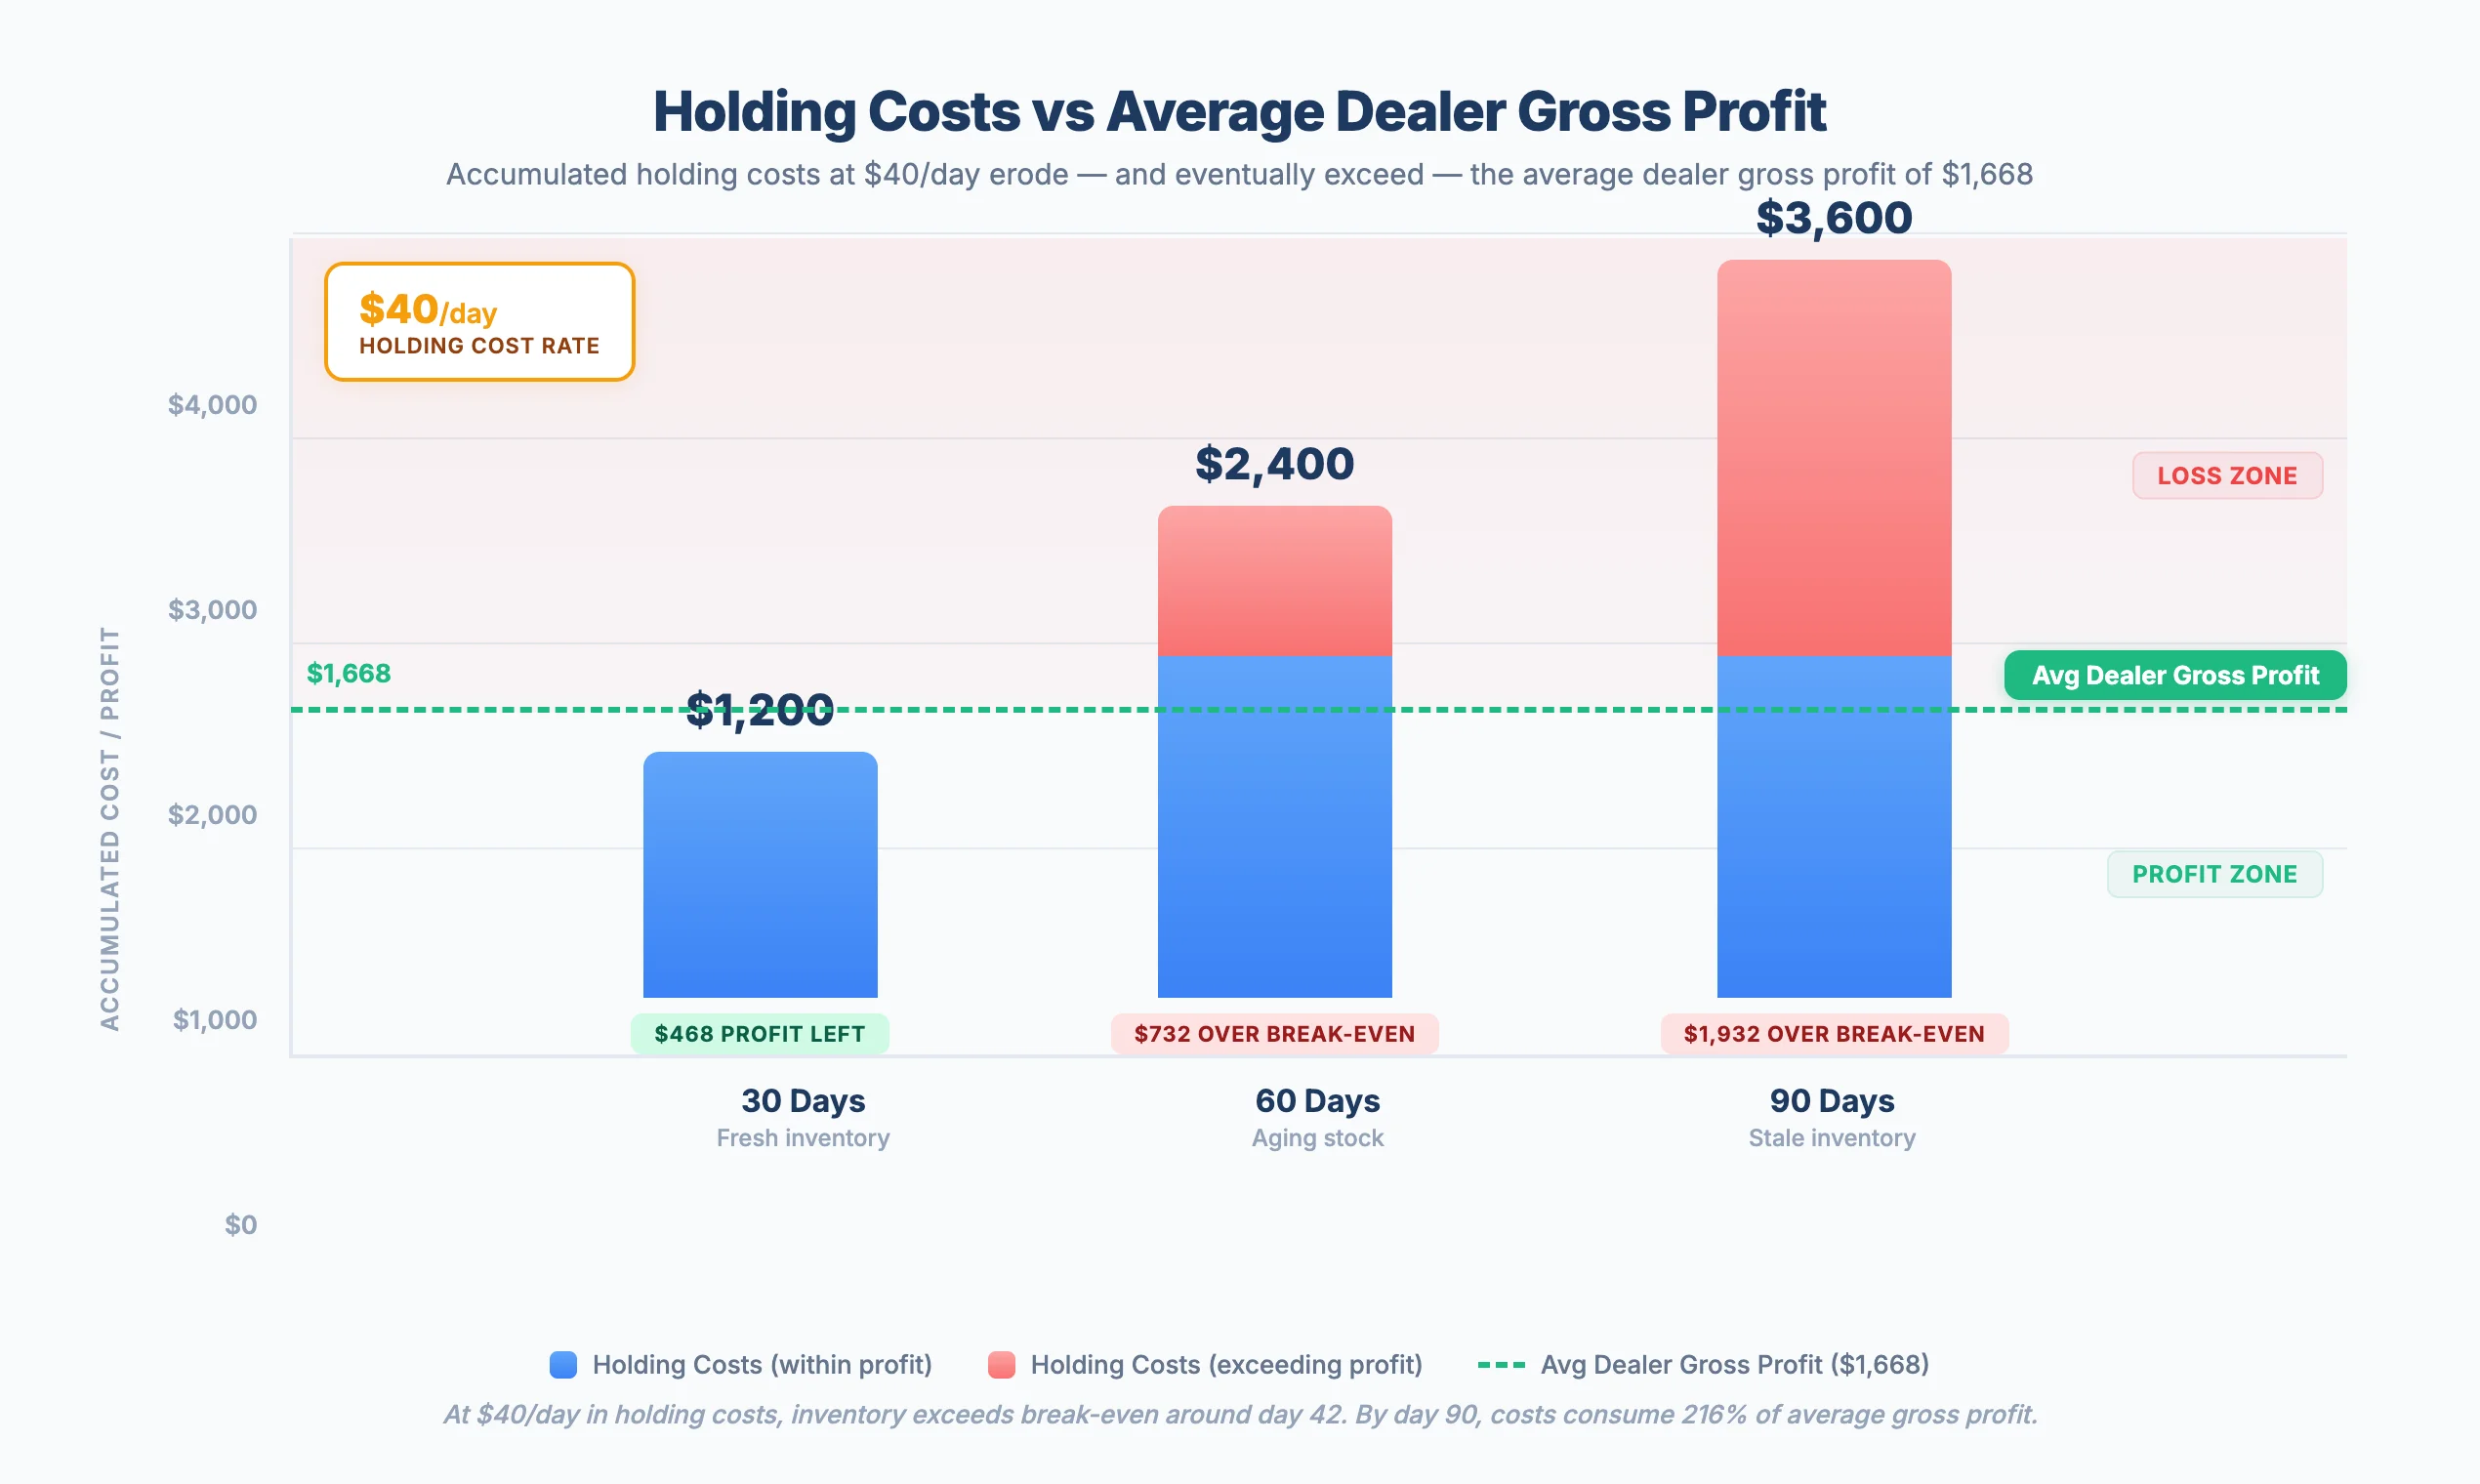 At $40/day in holding costs, a vehicle held for 60 days consumes $2,400 — more than the average used vehicle gross profit of $1,668.
Depreciation Curves — The 30/60/90-Day Windows
Vehicle depreciation does not follow a straight line. In the first 30 days, a vehicle depreciates at roughly the prevailing market rate — manageable and predictable. After day 30, depreciation accelerates as the listing ages on platforms, buyer perception shifts, and the vehicle enters a cohort of stale inventory that attracts fewer views and lower bids. For a granular week-by-week breakdown of this curve with category-specific benchmarks, see the Inventory Depreciation Timeline.
The average annual depreciation rate for used vehicles reached -12.5% in 2024. Spread evenly, that translates to roughly 1% per month — but the distribution is front-loaded on aged units. A vehicle that loses 2% of its value in days 1–30 can lose 8–12% in days 31–60 as remarketing platforms de-prioritize older listings and buyers associate time-on-market with hidden problems.
| Aging Window | Depreciation Behavior | Margin Impact | Recommended Action |
|---|---|---|---|
| 0–30 Days | Normal market-rate depreciation | Margin largely preserved | Price at market; monitor weekly |
| 31–45 Days | Accelerating depreciation; market perception shifts | Margin eroding; approaching break-even | Initiate first price reduction (3–5%) |
| 46–60 Days | Rapid depreciation; listing fatigue sets in | Margin likely negative after holding costs | Aggressive repricing (5–10%); consider wholesale or re-auction |
| 61–90 Days | Steep depreciation; buyer perception of stale inventory | Deep loss territory; holding costs dominate | Wholesale immediately or re-auction at no-reserve |
| 90+ Days | Floorplan curtailment trigger; lender pressure | Capital trapped; opportunity cost compounding | Liquidate at any available channel |
The True Cost of Inventory Aging
Holding costs are not a single line item. They are the sum of seven distinct cost components, each accumulating daily from the moment a vehicle lands on the lot. Net floorplan expense rose approximately 39% per unit in Q2 2025, making interest the fastest-growing component. Use the Floorplan Interest Cost Calculator to model your specific rate.
The range in total daily holding costs — $27–$58 at the conservative end, up to $85 at the high end — reflects differences in floorplan rates, lot location, and operational efficiency. Urban dealers with high facility costs land closer to the $85 figure. Dealers with low-cost rural lots and favorable floorplan terms operate near $37. Regardless of where you fall in that range, the math compounds identically: costs accrue daily and never reverse.
| Cost Component | Typical Daily Cost | Monthly (30 Days) | Notes |
|---|---|---|---|
| Floorplan interest (SOFR + 300 bps) | $3–$5 | $90–$150 | Net floorplan expense rose ~39% per unit in Q2 2025 |
| Insurance | $1–$2 | $30–$60 | Comprehensive + liability on dealer lot |
| Depreciation allocation | $15–$30 | $450–$900 | Based on -12.5% annual rate on $14K vehicle |
| Lot rent / facility cost | $3–$8 | $90–$240 | Varies by market; urban lots significantly higher |
| Reconditioning amortization | $2–$5 | $60–$150 | Spread recon investment across expected hold time |
| Maintenance and cosmetic upkeep | $1–$3 | $30–$90 | Battery tending, washing, tire inflation |
| Administrative overhead | $2–$5 | $60–$150 | Listing management, CRM, photo updates |
| Total (conservative) | $27–$58 | $810–$1,740 | NCM midpoint ~$40; Pollak midpoint ~$85 |
Optimal Pricing Strategy — The Staged Reduction Framework
Pricing is not a one-time decision. It is a schedule that should be established at acquisition and executed without hesitation. The staged reduction framework below aligns price cuts to the depreciation curve, ensuring the vehicle stays competitive at every aging window. Each step reflects a deliberate trade-off: accept a smaller margin today to avoid a larger loss tomorrow. For a deep dive into setting the initial starting price, reserve vs no-reserve decisions, and seasonal timing, see the Auction Vehicle Pricing Strategy cluster guide.
Days 1–14: Price at market
Set the initial asking price at or slightly above market comparables. The vehicle is fresh inventory; buyers perceive it as new stock. No reduction needed. Monitor views, saves, and lead activity daily.
Days 15–30: First micro-adjustment (2–3%)
Reduce the price by 2–3% to maintain search ranking on listing platforms and signal competitive pricing. Monitor view-to-lead conversion rate. If leads are strong, hold the current price through day 30.
Days 31–45: Meaningful reduction (5–7% cumulative)
Apply a second, larger cut. The vehicle is approaching the industry 45-day sell-through benchmark. Price must compensate for the growing holding cost burden. This is the inflection point — action here prevents larger losses later.
Days 46–60: Aggressive repricing (10–15% cumulative)
Cross the break-even analysis threshold. If the vehicle has not sold, the price is wrong for the market. Accept compressed margin or a small loss to recover capital. Use the Break-Even / Max Bid Calculator to confirm your floor.
Days 61+: Liquidation or re-auction
The vehicle is now a capital trap. List at wholesale, re-auction at no-reserve, or offer to wholesale buyers at a distressed price. Every additional day costs more than any potential retail recovery.
When to Re-Auction — Break-Even Analysis and Channel Selection
The decision to wholesale or re-auction a vehicle should be driven by break-even analysis, not by attachment to the original purchase price. Calculate the break-even point by adding all incurred costs — acquisition price, buyer fees, reconditioning, and cumulative holding costs — then compare that total to the current wholesale market value. If the break-even exceeds what the market will pay, every additional day of holding increases the loss.
Once the decision to exit is made, five channels are available — each aligned with a different auction type. Each carries different speed, cost, and recovery trade-offs.
- Wholesale auction (timed online) — Broadest buyer reach; expect approximately 55% average sell rate; use no-reserve to guarantee sale
- Physical auction lane — Effective for vehicles with cosmetic appeal that benefits from in-person inspection; higher hammer price potential on well-presented units
- Buy-now / fixed-price listing — Fastest exit; price at 5–10% below current wholesale book to attract immediate buyers
- Direct wholesale to another dealer — No auction fees; requires established relationships; best for niche vehicles with a known buyer
- Trade-in credit against new acquisition — Offset the loss against a higher-margin incoming unit; nets a better effective recovery than standalone liquidation
Seasonal Demand Factors
Wholesale prices follow predictable seasonal patterns driven by consumer buying behavior, fleet disposal cycles, and new model year timing. NAAA data from 7.6 million vehicles sold in 2024 at an average wholesale price of $13,921 confirms these patterns repeat annually with consistent magnitude.
Dealers who align acquisition and liquidation timing to seasonal demand capture margin that timing-blind operators leave on the table. The spring tax-refund window (late Q1 through early Q2) consistently produces a 5% premium above baseline wholesale prices. The Q3 back-to-school period produces a 2% discount as demand shifts toward new model year vehicles and off-lease supply increases.
| Season | Quarter | Wholesale Price Effect | Demand Driver | Inventory Strategy |
|---|---|---|---|---|
| Tax Season / Spring | Q1–Q2 | +5% premium above baseline | Tax refunds boost consumer buying | Maximize retail exposure; hold strong inventory for peak demand |
| Summer | Q2–Q3 | Neutral to slightly positive | Steady retail demand; vacation season | Maintain pricing; avoid over-stocking ahead of Q3 dip |
| Back-to-School / Fall | Q3 | -2% below baseline | Demand shifts to new model year | Aggressive aging policy; liquidate slow movers before prices soften further |
| Year-End / Holiday | Q4 | Mixed; late-Q4 fleet dump depresses prices | Fleet disposals increase supply | Buy opportunity for well-capitalized dealers; build inventory for Q1 selling season |
Calculating Your Inventory Aging Risk Score
Every vehicle in your current inventory carries a quantifiable aging risk based on three variables: days on lot, daily holding cost rate, and the gap between your current asking price and the market floor. Vehicles with high days-on-lot, high holding costs, and a narrow or negative gap between asking price and market value represent immediate capital risk.
A systematic risk score removes subjectivity from the hold-vs-sell decision. Rather than relying on manager intuition or weekly lot walks, a formula-driven approach surfaces the vehicles that demand immediate attention. Kelley Automotive Group demonstrated the compounding value of speed: reducing their time-to-line from 7.4 days to three days generated $399,446 in additional gross profit.
Building a Systematic Inventory Aging Policy
An aging policy removes emotion and optimism from pricing decisions. The policy defines fixed thresholds, assigns authority, and creates accountability. Without a written policy, pricing decisions default to whoever is most attached to the vehicle — and attachment is the enemy of inventory velocity.
Autorola documented a case study where a 10-day reduction in average time-to-market across 25,000 vehicles produced EUR 7.5M in savings. That result came from process discipline, not pricing genius. The checklist below captures the elements of an enforceable aging policy.
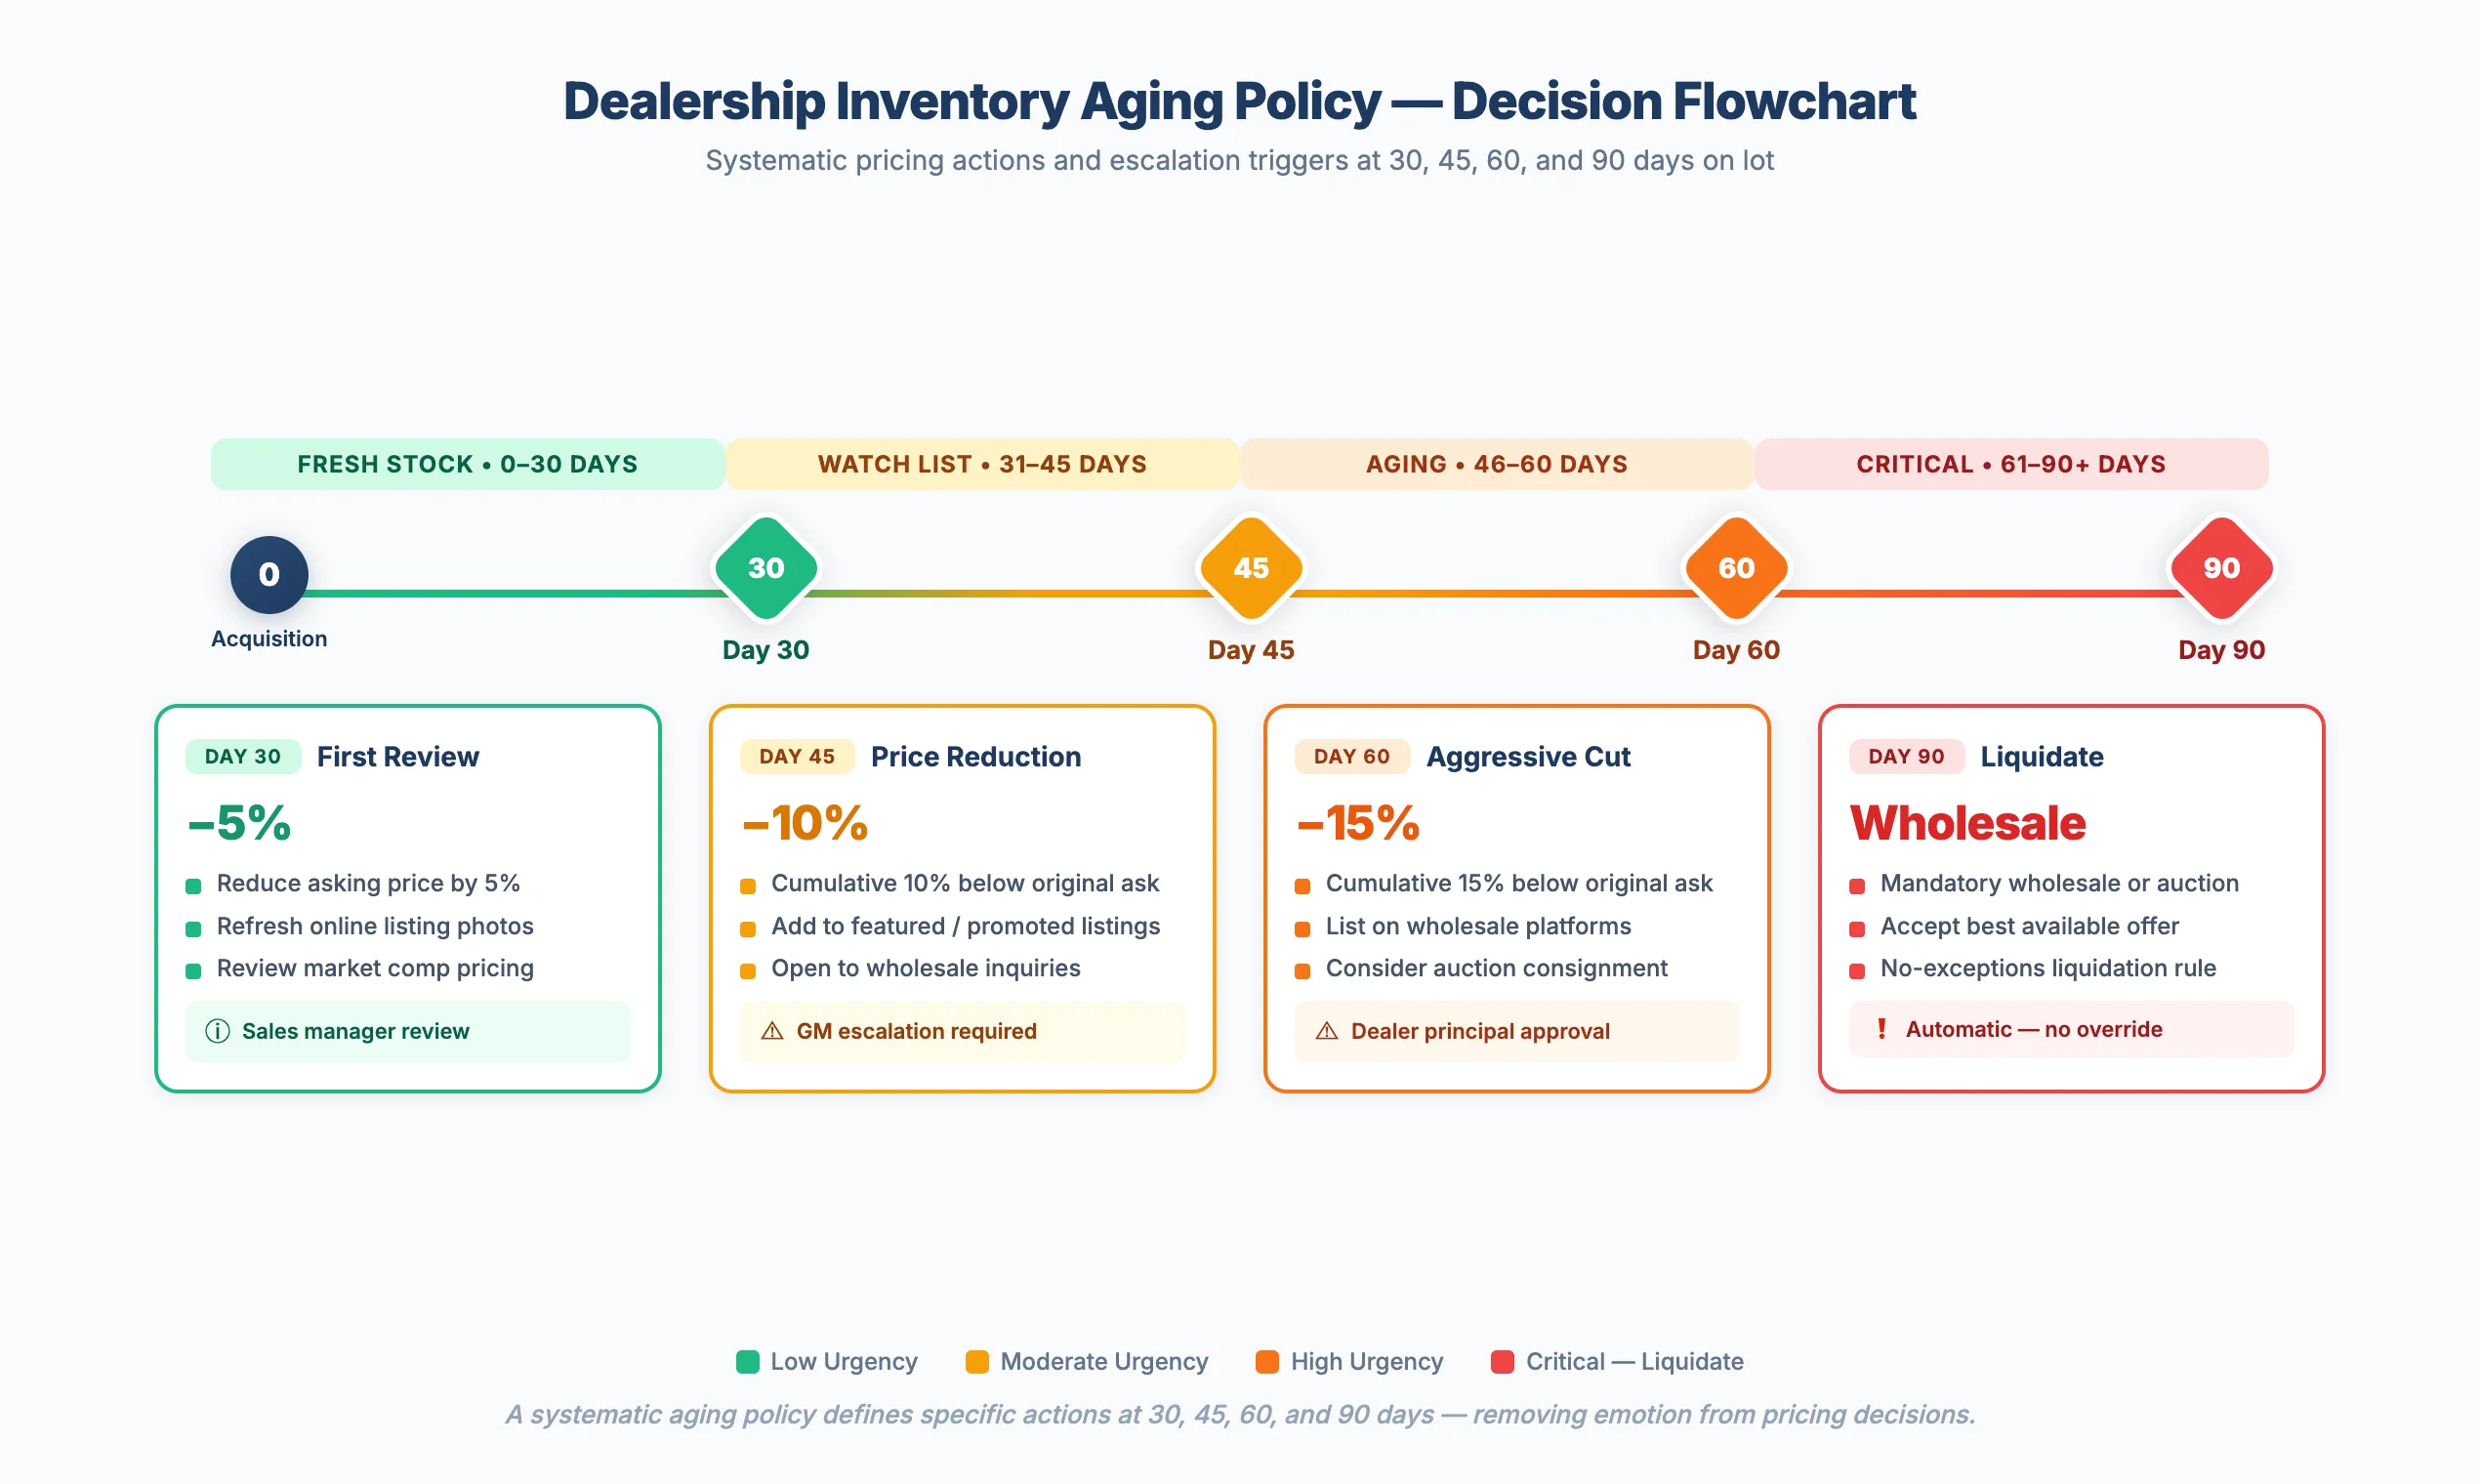 A systematic aging policy defines specific actions at 30, 45, 60, and 90 days — removing emotion from pricing decisions.
Dealership Inventory Aging Policy Checklist
0 of 10 completedFrequently Asked Questions
What is the ideal days-to-sale for used vehicles?
The industry benchmark is 45 days from acquisition to sale. Average days-to-sale across the market runs 41–50 days, with vehicles priced under $15,000 averaging 36 days and EVs averaging 34 days. Operations targeting high inventory turns aim for 30–35 days. The 45-day benchmark represents the point beyond which holding costs exceed the margin on an average-grossing used vehicle ($1,668 per unit in Q2 2025).
How much does it cost to hold a vehicle for one month?
Monthly holding costs range from $810 to $1,740 per vehicle, depending on your floorplan rate, lot location, and operational overhead. The NCM benchmark places the daily rate at $37–$40, while Pollak’s analysis puts it closer to $85/day for operations with higher facility and administrative costs. At the $40/day midpoint, 30 days costs $1,200. At $85/day, 30 days costs $2,550.
When should I reduce the price on a vehicle that is not selling?
Initiate the first micro-reduction (2–3%) at day 15 if lead activity is below comparable vehicles. Apply a meaningful reduction (5–7% cumulative) at day 30–45. By day 46–60, reprice aggressively (10–15% cumulative) or initiate wholesale/re-auction. Waiting beyond 60 days to make the first reduction is the single most common pricing error — by that point, depreciation and holding costs have already consumed any remaining margin.
Should I wholesale a vehicle or keep reducing the retail price?
Wholesale when the break-even analysis shows that cumulative costs (acquisition + fees + reconditioning + holding) exceed the current retail market ceiling for the vehicle. Also wholesale when the vehicle has exceeded 60 days on lot, when the segment is oversupplied, or when floorplan curtailment is approaching. The capital freed by wholesaling one aged unit at a loss can fund the acquisition of a faster-turning replacement that generates positive margin.
How does floorplan curtailment work?
Floorplan lenders typically trigger curtailment — a mandatory principal payment — at 90 or 120 days after advance. The curtailment amount is usually 10–25% of the original advance, due immediately. If the vehicle remains unsold, subsequent curtailments follow at additional 30-day intervals. Curtailment converts a manageable interest expense into an acute cash flow event. Dealers who enforce a 60-day liquidation policy avoid curtailment entirely.
Conclusion
Inventory aging is a controllable cost, but only when managed systematically. The data is clear: daily holding costs of $37–$85 compound relentlessly, used vehicle gross profit per unit has compressed to $1,668, and the 45-day benchmark exists because the math shifts from recoverable to destructive beyond that point. Dealers who know their daily holding rate, enforce staged price reductions aligned to depreciation curves, and liquidate without hesitation at their policy threshold consistently outperform those who wait.
The tools exist to make this process repeatable. Use the Inventory Aging Risk Score to surface at-risk vehicles weekly. Use the Price Reduction Planner to automate markdown schedules. Understand the auction fee structure at each channel so liquidation costs are predictable. Factor reconditioning ROI into every acquisition decision. And build a written aging policy — with fixed thresholds, assigned authority, and no exceptions — that turns inventory management from a judgment call into a process.