
Daily holding costs of $37–$85 per vehicle accumulate from the moment a unit lands on the lot, and they never reverse. The inventory depreciation timeline from acquisition to sale — tracked week by week against average used vehicle gross profit of $1,668 per unit — determines whether a vehicle generates margin or consumes it.
This article maps the depreciation timeline in detail, breaks down holding cost components at 30, 60, and 90 days, and establishes action triggers at each milestone. It expands on the framework introduced in the Inventory Aging and Pricing Strategy pillar guide with granular weekly data and category-specific benchmarks.
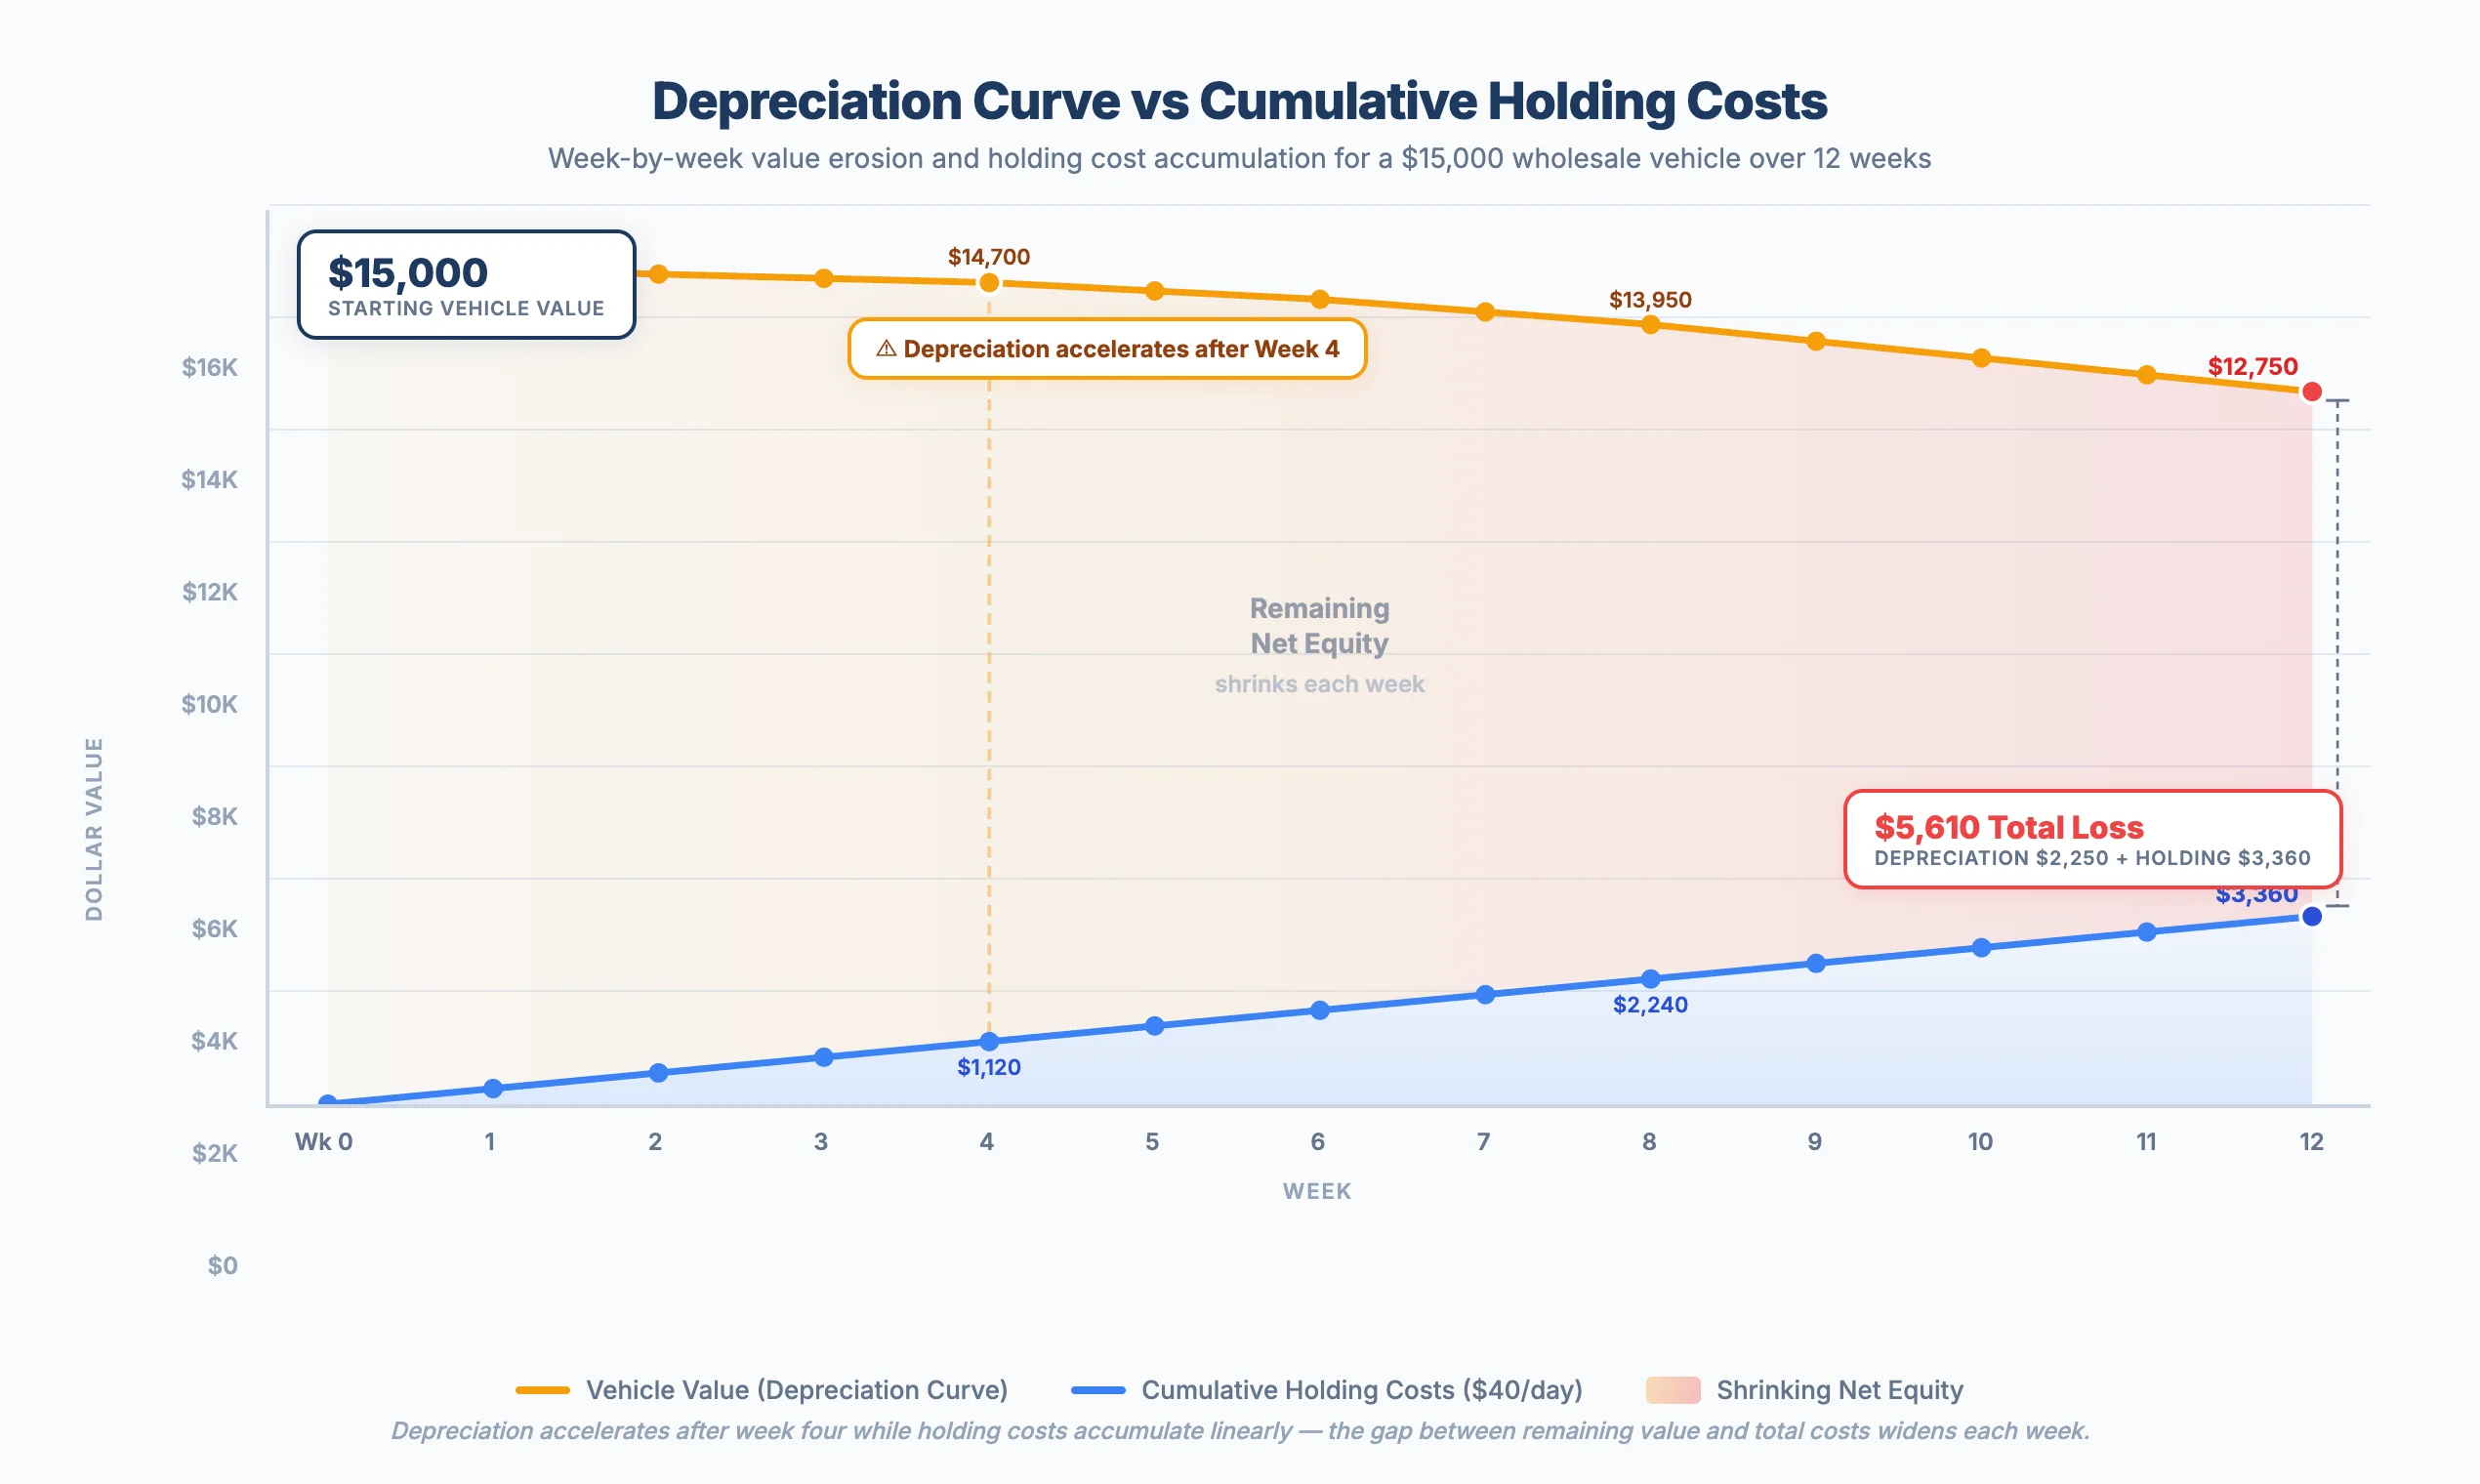 Depreciation accelerates after week four while holding costs accumulate linearly — the gap between the two widens each week.
The 90-Day Depreciation Window
The 90-day mark is the industry standard for inventory aging because the math becomes unrecoverable beyond it. Black Book and Fitch Ratings report annual depreciation of -15.3% for vehicles aged two to six years in 2025 — a rate that does not distribute evenly across the holding period.
The first 30 days produce manageable, market-rate depreciation. Days 31–60 bring accelerating value loss as listing fatigue and buyer perception shifts compound. Days 61–90 enter destructive territory where depreciation and holding costs together consume more than the vehicle can recover at sale.
Floorplan lenders reinforce this boundary. Most curtailment triggers activate at 90–120 days, requiring mandatory principal payments of 10–25% of the original advance. The 90-day window is not arbitrary — it reflects the point where remarketing economics, buyer psychology, and lender policy converge to make continued holding irrational.
Week-by-Week Depreciation Timeline
| Week | Days on Lot | Cumulative Depreciation | Est. Value Loss ($15K Vehicle) | Risk Level |
|---|---|---|---|---|
| 1 | 1–7 | ~0.5% | $75 | Low |
| 2 | 8–14 | ~1.0% | $150 | Low |
| 3 | 15–21 | ~1.5% | $225 | Low |
| 4 | 22–28 | ~2.0% | $300 | Low |
| 5 | 29–35 | ~3.0% | $450 | Moderate |
| 6 | 36–42 | ~4.0% | $600 | Moderate |
| 7 | 43–49 | ~5.5% | $825 | Elevated |
| 8 | 50–56 | ~7.0% | $1,050 | Elevated |
| 9 | 57–63 | ~9.0% | $1,350 | High |
| 10 | 64–70 | ~11.0% | $1,650 | High |
| 11 | 71–77 | ~13.0% | $1,950 | Critical |
| 12 | 78–84 | ~15.0% | $2,250 | Critical |
The acceleration pattern reflects three overlapping forces. Listing fatigue reduces buyer engagement as online platforms de-prioritize older inventory in search results. Buyer perception shifts — vehicles with high days-on-market signal hidden problems, even when none exist. Competitive pressure intensifies as newer, fresher inventory enters the market each week and draws bids away from aged units.
Holding Cost Accumulation
| Cost Component | 30 Days | 60 Days | 90 Days |
|---|---|---|---|
| Floorplan interest (SOFR + 300 bps) | $90–$150 | $180–$300 | $270–$450 |
| Insurance + lot rent | $120–$300 | $240–$600 | $360–$900 |
| Maintenance + admin | $90–$240 | $180–$480 | $270–$720 |
| Depreciation allocation | $450–$900 | $975–$1,500 | $1,650–$2,250 |
| Total | $750–$1,590 | $1,575–$2,880 | $2,550–$4,320 |
Floorplan interest is the fastest-growing cost component in the current rate environment. Net floorplan expense rose approximately 39% per unit in Q2 2025 as prevailing rates remained elevated. At SOFR + 300 basis points on a $15,000 vehicle, daily interest runs $3–$5 — modest in isolation, but compounding across an entire lot of 80–150 units produces a six-figure monthly interest bill.
Opportunity cost is the most overlooked component. Capital tied up in an aging vehicle cannot fund a faster-turning replacement. A unit held for 90 days occupies a floorplan line, a lot space, and management attention that could generate two or three turns on a vehicle priced and sold within 30 days.
Days-to-Sale Benchmarks by Category
| Vehicle Category | Avg. Days to Sale | Target (Top Quartile) | Key Factor |
|---|---|---|---|
| Economy / Sub-$15K | 36 days | 25–30 days | Price sensitivity drives fast turns |
| Mainstream Sedans | 41–45 days | 30–35 days | High supply; competitive pricing essential |
| Trucks / SUVs | 38–42 days | 28–33 days | Strong demand absorbs slightly higher pricing |
| EVs / Hybrids | 34 days | 25–28 days | Fastest-turning; steep depreciation creates demand |
| Luxury / Premium | 45–55 days | 35–40 days | Narrower buyer pool; condition-sensitive |
| High-Mileage (120K+ mi) | 50–60 days | 38–45 days | Market ceiling limits demand |
EVs and hybrids are the fastest-turning segment at 34 days average despite carrying the steepest depreciation rates in the market. Rapid value erosion creates pricing opportunities that attract buyers seeking discounts on newer technology. Luxury and premium vehicles sit at the opposite end — narrower buyer pools and condition sensitivity extend the sales cycle to 45–55 days, making aggressive aging policy enforcement critical for this segment.
How Depreciation and Holding Costs Compound
Depreciation and holding costs do not simply add up — they compound. A worked example illustrates how the two forces interact on a single vehicle. Starting cost basis: $15,000 acquisition price + $700 buyer fees + $1,500 reconditioning = $17,200 total investment.
The table below tracks total erosion against that $17,200 cost basis. Note how the percentage of purchase price consumed accelerates at each milestone — the hold-or-sell decision at day 30 determines whether the loss remains manageable or enters destructive territory.
| Milestone | Depreciation Loss | Holding Costs | Total Erosion | % of Purchase Price |
|---|---|---|---|---|
| Day 30 | ~$225 | $750–$1,590 | $975–$1,815 | 6.5–12.1% |
| Day 60 | ~$975 | $1,575–$2,880 | $2,550–$3,855 | 17.0–25.7% |
| Day 90 | ~$2,250 | $2,550–$4,320 | $4,800–$6,570 | 32.0–43.8% |
Warning Signs of Aging Inventory
Depreciation does not announce itself — it shows up in leading indicators that surface weeks before the financial damage becomes irreversible. Monitor these six warning signs across every unit in inventory:
- Fewer than two leads per week after the first 14 days on lot
- Online listing views declining week over week for three or more consecutive weeks
- No price adjustment made in the first 30 days despite below-average lead activity
- Vehicle passed over at two or more wholesale auctions without a bid meeting reserve
- Comparable vehicles from competitors listed at lower prices with similar or better condition
- Floorplan curtailment deadline within 30 days
Action Triggers at 30, 60, and 90 Days
Day 30: First Price Review
Evaluate lead activity, views, and market comparables. If below-average performance, reduce asking price by 3–5%. If on track, hold price but schedule a day-45 review. Consequence of inaction: entering the accelerating depreciation window without a pricing adjustment.
Day 60: Aggressive Repricing or Channel Switch
The price is wrong for the market. Reduce by 10–15% cumulative or move to wholesale/re-auction. Use the Break-Even Max Bid Calculator to confirm your floor price. Consequence of inaction: holding costs now exceed average gross profit.
Day 90: Liquidation
No exceptions. List at wholesale, re-auction at no-reserve, or offer to wholesale buyers at a distressed price. Consequence of inaction: capital trapped, curtailment triggered, opportunity cost compounding.
Frequently Asked Questions
How fast does a used vehicle depreciate on a dealer lot?
Black Book data shows wholesale values depreciate approximately 0.5% per week under normal conditions, though spikes beyond 1% per week occur during seasonal shifts. Depreciation accelerates after day 30 as listing fatigue compounds — a vehicle may lose 1.5% in the first month and 8–12% in the next.
What is a good days-to-sale target for used vehicles?
The industry benchmark is 45 days. Top-performing dealers target 30–35 days and sell 60–70% of inventory within the first 30 days. Vehicles priced under $15,000 average 36 days; EVs average 34 days.
How much does floorplan interest cost per day?
Daily floorplan interest runs $3–$5 per vehicle on a $15,000 unit at prevailing rates (SOFR + 300 bps). Use the Floorplan Interest Cost Calculator for your exact figure.
When does floorplan curtailment kick in?
Most lenders trigger curtailment at 90 or 120 days. The curtailment amount is typically 10–25% of the original advance, due immediately. Enforcing a 60-day liquidation policy avoids curtailment entirely.
Should I hold longer if the market improves?
Only if data confirms the trend for your specific segment. A rising market does not help a stale listing — buyer perception of aged inventory overrides market conditions. Run the Inventory Aging Risk Score to compare holding cost against expected uplift before deciding to hold.
Conclusion
The depreciation timeline is the core variable in every used vehicle pricing decision. Each week of holding compounds value loss and cost accumulation in a non-linear pattern that favors early action over delayed hope. Use this week-by-week framework alongside the Inventory Aging and Pricing Strategy guide, the Floorplan Interest Cost Calculator, and the Inventory Aging Risk Score to convert aging data into pricing action at every milestone.