
NAAA members sold 7.6 million vehicles for $105 billion in gross wholesale value during 2024, at an average hammer price of $13,921. With average used vehicle gross profit at $1,668 per unit and margins running 5.4%, a disciplined pricing strategy determines whether a vehicle contributes margin or erodes it.
This article establishes a data-driven pricing framework — from valuation tool selection through starting price psychology, reserve strategy, and seasonal timing. It expands on the methodology introduced in the Inventory Aging and Pricing Strategy pillar guide. For the holding cost math that underpins every pricing decision here, see the Inventory Depreciation Timeline.
Market Research — Valuation Tools and Data Sources
Accurate pricing starts with accurate market data. Four primary valuation sources cover the wholesale market across North America and Europe, each with a different update cadence, data methodology, and regional strength. No single source captures the full picture — cross-referencing at least two before setting a starting price reduces the risk of anchoring to stale or regionally skewed data.
MMR (Manheim Market Report) processes millions of wholesale transactions over a rolling 13-month window with nightly refreshes, making it the most granular wholesale benchmark in North America. Black Book delivers daily VIN-specific valuations using 1,200+ data elements per vehicle, including its proprietary History Adjusted Values. Glass’s Guide feeds daily UK and European data with local expert review, providing historic, current, and forecast values. NAAA composite data tracks annual volume and conversion metrics across all member auctions.
| Valuation Source | Update Frequency | Data Scope | Region Strength |
|---|---|---|---|
| MMR (Manheim Market Report) | Nightly | Millions of transactions, 13-month window | North America wholesale benchmarking |
| Black Book | Daily | VIN-specific, 1,200+ data elements | Per-vehicle valuation (North America) |
| Glass's Guide | Daily with local expert review | UK/EU regional feeds, historic + forecast | European market pricing |
| NAAA Composite | Quarterly / Annual | 7.6M vehicles sold in 2024 | Market trend analysis |
Starting Price Strategy
Starting price determines bidding momentum. Research from the Kellogg School of Management — analyzing 179 Persian rug auctions and 87 Nikon camera listings — found that lower starting prices consistently generate higher final sale prices. The mechanism is straightforward: low opening bids attract more initial bidders, create visible competition, and trigger escalation behavior that drives the final price above what a high starting bid would have achieved alone.
Opening bids set 15–20% below estimated market value generate 23% more bidding activity than bids anchored at or near the estimate. The key is calibrating the discount to attract attention without signaling distress.
Before setting the starting price, evaluate five factors:
- Condition report data — mechanical condition, cosmetic grade, and disclosure items directly affect buyer willingness to bid
- Days in stock and holding cost — vehicles past 30 days carry $37–$85/day in accumulated cost that reduces the effective floor
- Comparable active listings — check MMR and Black Book for current comps within the same model year, mileage band, and grade
- Seasonal position — demand fluctuates by segment and calendar quarter (see the seasonal adjustments section below)
- Margin vs liquidation urgency — fresh inventory tolerates a higher anchor; aged inventory requires aggressive pricing to trigger activity. Use the Break-Even Max Bid Calculator to determine the floor
Reserve vs No-Reserve Strategy
The reserve decision is the single highest-impact variable in auction sell-through rate. The following table summarizes performance differences between the two approaches based on platform data.
| Factor | Reserve Auction | No-Reserve Auction |
|---|---|---|
| Sell-through rate | ~74% | 100% |
| Listing visibility | Standard | 5–10% more views |
| Bidder participation | Standard pool | +12% unique bidders |
| Downside risk | Protected by floor price | Exposed to below-market sale |
| Re-run risk | Failed units depress subsequent bids | Not applicable |
| Suited for | High-value or scarce units | Aged inventory, common models |
Reserve price auctions protect against below-market outcomes but carry a structural cost: 26% of reserved listings fail to sell. Re-running a no-sale vehicle creates what analysts call a “two-fold negative” — the vehicle failed publicly, and repeat exposure degrades buyer perception. Each re-run typically achieves lower bids than the previous attempt.
No-reserve listings eliminate this risk entirely. They attract 5–10% more views and engage approximately 12% of bidders who only participate in no-reserve auctions. The trade-off is full downside exposure — the vehicle sells at whatever the market offers. For common models past 45 days in stock, the math usually favors no-reserve because holding costs already exceed the gap between market value and a worst-case auction result.
OPENLANE recommends using Black Book price ranges as the baseline for setting reserves. When a reserve is lifted with three or more days remaining in a timed auction, bidder count increases by 25% — a useful tactic for units approaching their sell-by threshold.
Pricing Psychology and Bidder Behavior
Auction pricing operates on three psychological levers that experienced remarketing professionals can calibrate to increase final sale prices.
Anchoring low. A low starting price sets a reference point that attracts initial bids. Once bidders invest time and attention, escalation of commitment takes over — they bid higher to avoid losing a contest they have already entered. The anchor must be low enough to generate early activity but credible enough to avoid signaling a damaged or problematic vehicle.
Social proof. Visible bid counts and bidder activity create urgency. Platforms that display the number of active bidders or watchers amplify this effect. A listing with 14 bids signals market validation and draws additional participants who might otherwise skip the vehicle. No-reserve listings generate this social proof faster because the low barrier to entry produces early bid volume.
Scarcity framing. Timed auctions with clear closing deadlines create natural scarcity. Buy-now options layered onto timed listings add a second scarcity dimension — the risk of losing the vehicle to an impatient buyer. Sales conversion reached 60.7% in January 2026, up 3.2 percentage points from the three-year average, indicating that scarcity-driven urgency is increasing across wholesale channels.
Three steps to structure bidding pressure:
- Set the opening bid 15–20% below market estimate to trigger anchoring
- Choose listing formats that display bid counts and watcher metrics to activate social proof
- Use timed auction formats with defined closing windows to create deadline-driven urgency
Seasonal Pricing Strategy and Dynamic Repricing
Wholesale prices follow predictable seasonal patterns. Tax refund season pushed wholesale prices up 2.7% year over year in January 2026 — compared to a long-term January average of just 0.4%. UK plate changes in March and September create measurable supply spikes. Convertibles peak in spring demand; SUVs and 4WD vehicles peak in fall. Pricing strategy must account for these cycles or risk listing against the seasonal current.
Wholesale days supply stood at 26.6 days in January 2026, below the 32-day pre-pandemic average. Tighter supply compresses the window for repricing — vehicles either sell fast or age past the point of recovery. Annual depreciation for two- to six-year-old vehicles runs -15.3%, so every week of seasonal misalignment compounds value erosion.
| Season / Event | Effect on Wholesale Prices | Pricing Action |
|---|---|---|
| Tax refund season (January–March) | +2–3% wholesale price lift | List higher-value units; raise reserves modestly |
| UK plate change (March, September) | Supply spike, temporary price softening | Price aggressively to move ahead of the wave |
| Spring (April–May) | Convertible and sport demand peaks | Shift convertible inventory to auction; hold SUVs |
| Fall (September–November) | SUV and 4WD demand peaks | List trucks and SUVs; discount remaining convertibles |
| Year-end (December) | Volume drops, selective buyer pool | Liquidate aged stock before year-end accounting close |
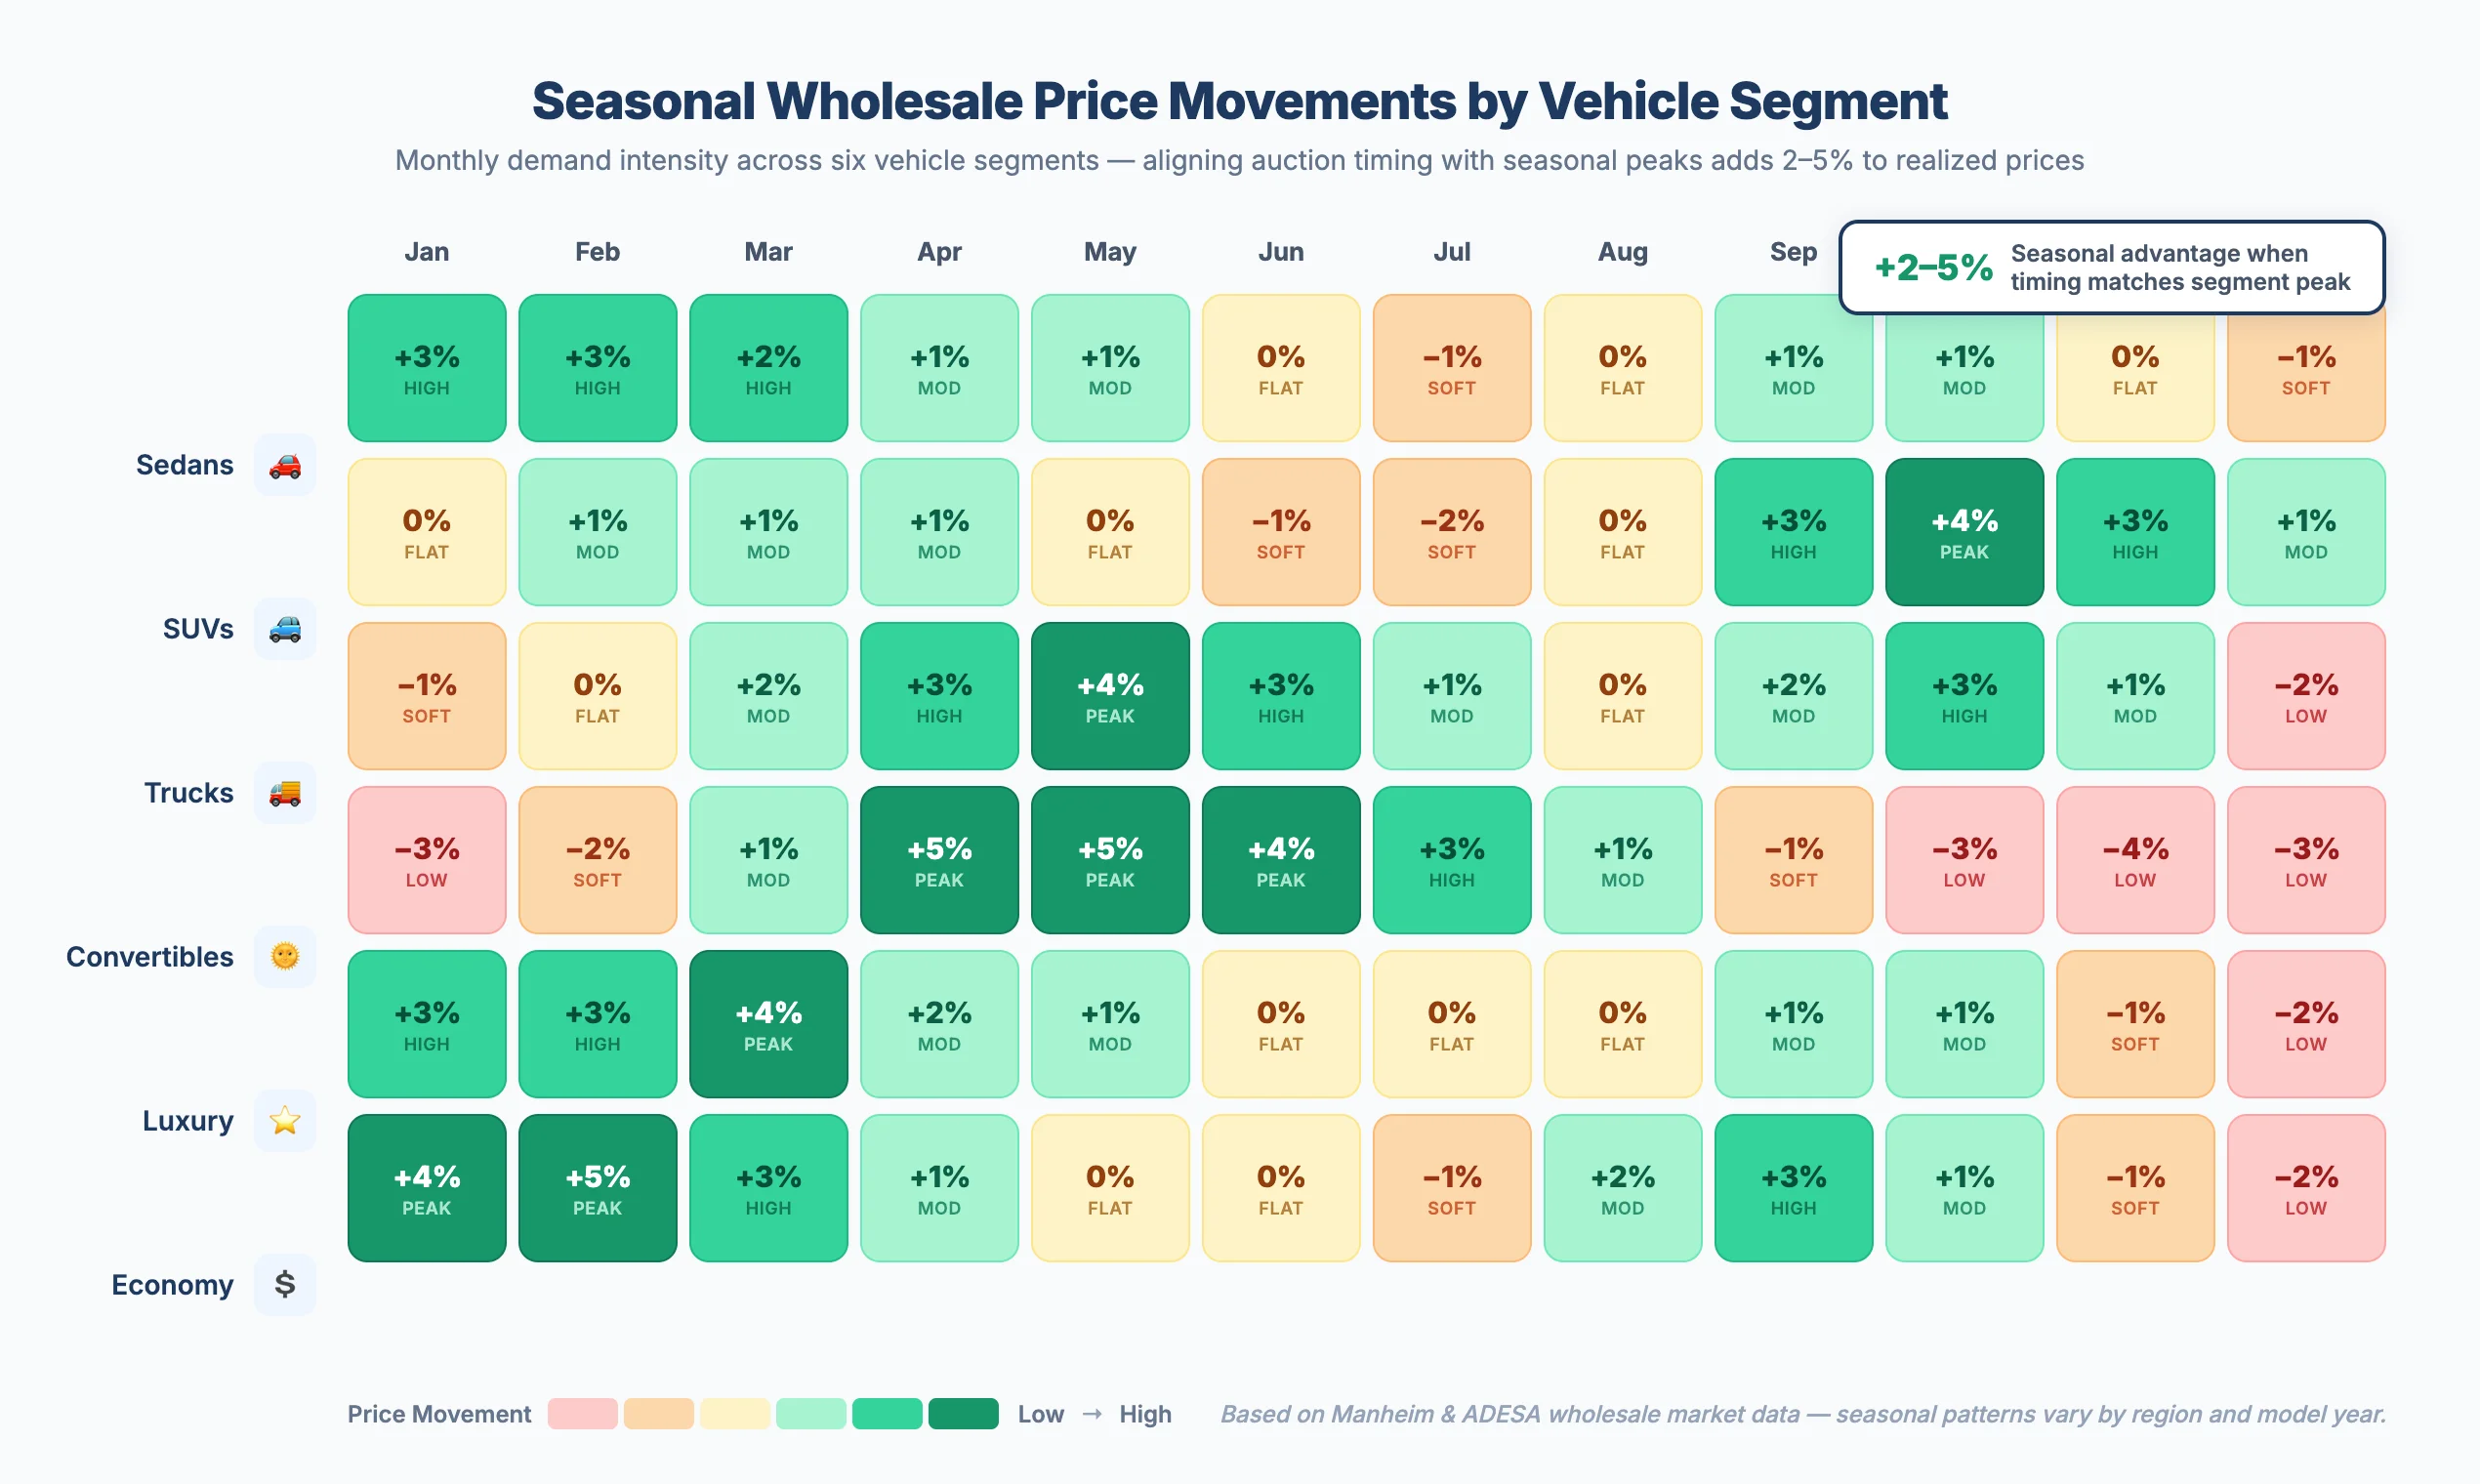 Aligning auction timing with seasonal demand patterns adds 2–5% to realized sale prices on segment-matched inventory.
Check the seasonal calendar
Identify the current position in the annual cycle. Cross-reference the vehicle segment (sedan, SUV, convertible) against the seasonal demand table above. Listing a convertible in November works against the market; holding it until March works with it.
Pull fresh comparable data
Run MMR or Black Book valuations within 48 hours of listing. Stale comps — even one week old — can misrepresent the current market during seasonal transitions when prices shift rapidly.
Set a reduction schedule at listing
Define price drops at day 15, 30, and 45 before the vehicle goes live. Use the Price Reduction Planner to model the reduction curve against holding costs.
Review every unit at day 30
Compare actual bidding activity against the reduction schedule. If the vehicle has not attracted bids within 10% of the target price, accelerate the schedule or switch to no-reserve. Waiting past day 30 without action enters the accelerating depreciation zone.
Frequently Asked Questions
How do I determine the right starting price for an auction vehicle?
Cross-reference at least two valuation sources — MMR for North American wholesale benchmarks and Black Book for VIN-specific data. Set the opening bid 15–20% below the estimated market value. Research shows this range generates 23% more bidding activity compared to starting at or near the estimate.
Should I use a reserve price or list no-reserve?
Reserve auctions sell through at approximately 74%, while no-reserve auctions achieve 100% sell-through with 5–10% more views. Use reserves for high-value or scarce units where downside protection matters. Use no-reserve for common models past 45 days in stock where holding costs exceed the risk of a below-market sale.
How much do seasonal patterns affect wholesale prices?
Seasonal effects vary by segment but can move wholesale prices 2–5% in either direction. Tax refund season (January–March) lifts prices across segments. UK plate changes in March and September create supply spikes. Convertibles peak in spring; SUVs peak in fall.
What happens if my vehicle does not sell at auction?
A failed auction listing creates a negative signal. Re-running the same vehicle typically produces lower bids because the failure is visible to buyers, and the perception of the vehicle degrades with each attempt. If reserve was the issue, consider lowering it or switching to no-reserve with three or more days of listing time remaining — this tactic increases bidder count by 25%.
How often should I reprice auction inventory?
Review every unit at day 15 and day 30. If bidding activity is below expectations at day 30, reduce the price by 10–15% cumulative or move to no-reserve. Daily holding costs of $37–$85 per vehicle mean that each week of inaction costs more than a modest price reduction.
Conclusion
Auction pricing is a system, not a single decision. The framework connects valuation research (MMR, Black Book, Glass’s Guide) to starting price calibration, reserve strategy selection, behavioral design, and seasonal timing — each element reinforcing the next. Dealers who treat pricing as a repeatable process, with pre-set reduction schedules and data-driven reserve decisions, consistently outperform those who rely on instinct or static pricing.
Apply this methodology alongside the Inventory Aging and Pricing Strategy pillar guide, the Inventory Aging Risk Score, and the Price Reduction Planner to convert market data into pricing action at every stage of the vehicle lifecycle.