
Why Structured Fleet Disposal Matters
NAAA members sold 7.6 million vehicles in 2024, generating $105 billion in gross wholesale sales. Fleet and leasing vehicles represent a significant share of that volume — and the pipeline is accelerating.
Off-lease returns are projected at 2.4 million units in 2025, rising to 3.2 million in 2026 and 3.6 million in 2027. EV lease returns alone are surging 200%+ in 2026 as three-year lease terms from 2023 begin cycling.
Depreciation accounts for 38% of total fleet vehicle cost, making disposal the primary lever for controlling total cost of ownership. Yet many fleet operations treat remarketing as an afterthought — listing vehicles on a single channel with minimal preparation and no recovery benchmarks. In a market where off-lease supply is growing faster than dealer demand, structured disposal separates fleet operations that recover 85–95% of book value from those that leave thousands per vehicle on the table. The Platform Directory provides a starting point for identifying channels matched to fleet volume and vehicle mix.
 Depreciation accounts for 38% of total fleet vehicle cost — structured disposal is the primary lever for controlling it.
The 7-Step Fleet Disposal Workflow
The following workflow covers the full disposal cycle, from fleet assessment through recovery tracking. Each step feeds into the next. Skipping steps — particularly vehicle preparation and post-sale recovery analysis — is where fleet operations lose recovery value at scale.
Assess the fleet
Evaluate each vehicle by age, mileage, maintenance cost trajectory, and residual value projection. Use the Inventory Aging Risk Score to identify units where holding costs exceed remaining residual value. EVs retain approximately 38% of original value after three years compared to 57% for ICE vehicles and take an average of 11 days to sell versus five for ICE — factor both into disposal timing.
Select disposal channels
Assign two to three channels per vehicle segment based on type, condition, and volume. A multi-channel disposal approach yields approximately $4,000 per vehicle in combined savings compared to single-channel dependency. Use the [Remarketing Channel Mix Calculator](/tools/remarketing-channel-mix-calculator/) to model allocation across channels.
Prepare vehicles for sale
Every $1 spent on reconditioning returns $2–$3 in recovery value. Basic reconditioning (cleaning, minor cosmetic repair) costs approximately $200 per vehicle. Comprehensive reconditioning (mechanical, tires, dent removal) runs approximately $1,000 per vehicle and is justified for higher-residual units. [Condition reports](/glossary/condition-report/) expand buyer reach from 35 miles for in-lane sales to 95 miles for [simulcast](/glossary/simulcast/) — invest in detailed reports with 20+ photos.
List on platforms
Use bulk listing tools (50+ vehicles per batch) and API integrations to reduce listing overhead at fleet scale. Set reserve prices using seasonality data — Q1 and Q2 pricing runs +3–5% above baseline, while Q3 dips approximately 2% below. Accurate vehicle descriptions and complete condition reports reduce post-sale disputes and arbitration claims.
Manage auctions
Monitor bidding activity across channels during auction windows. For vehicles that do not sell on the first listing, adjust reserves 5–10% downward and relist within seven days. Extended holding periods trigger storage fees and additional depreciation that erode recovery faster than a modest reserve reduction.
Handle logistics
Transport averages $1.03 per mile — use the [Transport ETA / Cost Estimator](/tools/transport-eta-cost-estimator/) to model costs by route. Pre-negotiate carrier contracts at fleet volume to secure consistent rates and priority scheduling. Coordinate pickup within 48 hours of sale to avoid post-auction storage fees, which typically start at $25–$50 per day after a three- to seven-day grace period.
Track recovery rates
Measure net recovery versus book value by channel, vehicle type, and season. Target 75% of vehicles sold within 30 days of listing. Feed recovery data back into Step 1 to refine fleet assessment criteria and disposal timing for the next cycle.
Fleet Disposal Cost Breakdown
Understanding each cost line is essential for setting accurate reserve prices. Underestimating disposal costs inflates expected net recovery and leads to reserves that fail to attract bids. Overestimating costs produces artificially low reserves that leave money on the table.
| Cost Category | Typical Range | Per-Vehicle Impact | Notes |
|---|---|---|---|
| Seller commission | $90–$100 avg | Fixed per transaction | Negotiable at fleet volume (100+ units/month) |
| Condition report | $50–$150 | Per vehicle | Expands buyer reach from 35 miles (in-lane) to 95 miles (simulcast) |
| Basic reconditioning | ~$200 | Per vehicle | Returns $2–$3 per $1 spent; cleaning, minor cosmetic repair |
| Comprehensive reconditioning | ~$1,000 | Per vehicle | Justified for higher-residual vehicles; mechanical, tires, dent removal |
| Transport | $1.03/mile avg | Variable by distance | Pre-negotiate contracts for volume; pickup within 48 hours |
| Storage fees | $25–$50/day | Per day unsold | Triggered 3–7 days post-auction; compounds rapidly on unsold inventory |
Seasonality and Timing
Wholesale vehicle prices follow consistent seasonal patterns driven by tax refund spending, dealer stocking cycles, and year-end fleet turnover. For a 500-vehicle fleet operation, the pricing swing between peak and trough quarters averages $2,800 per vehicle. Timing disposals to align with demand peaks is one of the highest-leverage actions a fleet manager can take.
Off-lease volume projections amplify the importance of timing. With 3.2 million off-lease returns expected in 2026 (up from 2.4 million in 2025), supply pressure will compress wholesale prices in periods of low demand. Fleet operations that front-load disposals into Q1 and Q2 capture peak pricing before seasonal and supply-driven declines.
| Quarter | Price Trend | Relative Impact | Fleet Action |
|---|---|---|---|
| Q1 (Jan–Mar) | Rising demand, tax refund season | +3–5% above baseline | Front-load disposals; highest recovery potential |
| Q2 (Apr–Jun) | Peak demand continues | +2–5% above baseline | Continue high-volume disposal while demand holds |
| Q3 (Jul–Sep) | Summer slowdown | −2% below baseline | Reduce volume or hold premium vehicles for Q4/Q1 |
| Q4 (Oct–Dec) | Year-end fleet turnover | Neutral to +1% | Dispose remaining cycle-end vehicles; clear aging inventory |
Fleet KPI Benchmarks
Five KPIs form a closed feedback loop for fleet disposal performance. Track each one monthly by channel and vehicle segment to identify problems before they compound across the fleet.
| KPI | Benchmark | Why It Matters | How to Track |
|---|---|---|---|
| Recovery Rate vs. Book Value | 85–95% | Primary measure of disposal effectiveness | (Net proceeds / book value) × 100; segment by vehicle type and channel |
| Days-to-Sale | Under 32 days avg | Extended holding increases depreciation and storage costs; target 75% within 30 days | Date sold − date listed; EVs average 11 days vs 5 for ICE |
| Channel Efficiency | Compare net recovery by channel quarterly | Identifies which platforms perform for each vehicle type | Net recovery per unit by channel; review quarterly to reallocate volume |
| Cost per Disposal | $340–$1,350 per vehicle | Must subtract from gross recovery to measure true net return | Sum of commission + recon + transport + storage + report per vehicle |
| Buyer Reach | 35 mi (in-lane) / 95 mi (simulcast) / 200+ mi (digital) | Wider reach correlates with higher hammer prices | Track average buyer distance by listing format; condition reports expand reach |
These five metrics connect directly: recovery rate measures overall disposal effectiveness, days-to-sale measures operational speed, channel efficiency identifies where to allocate volume, cost per disposal ensures accurate net recovery calculations, and buyer reach tracks the competitive environment for each listing format. Use the Inventory Aging Risk Score to flag vehicles approaching the threshold where holding costs exceed remaining recovery potential.
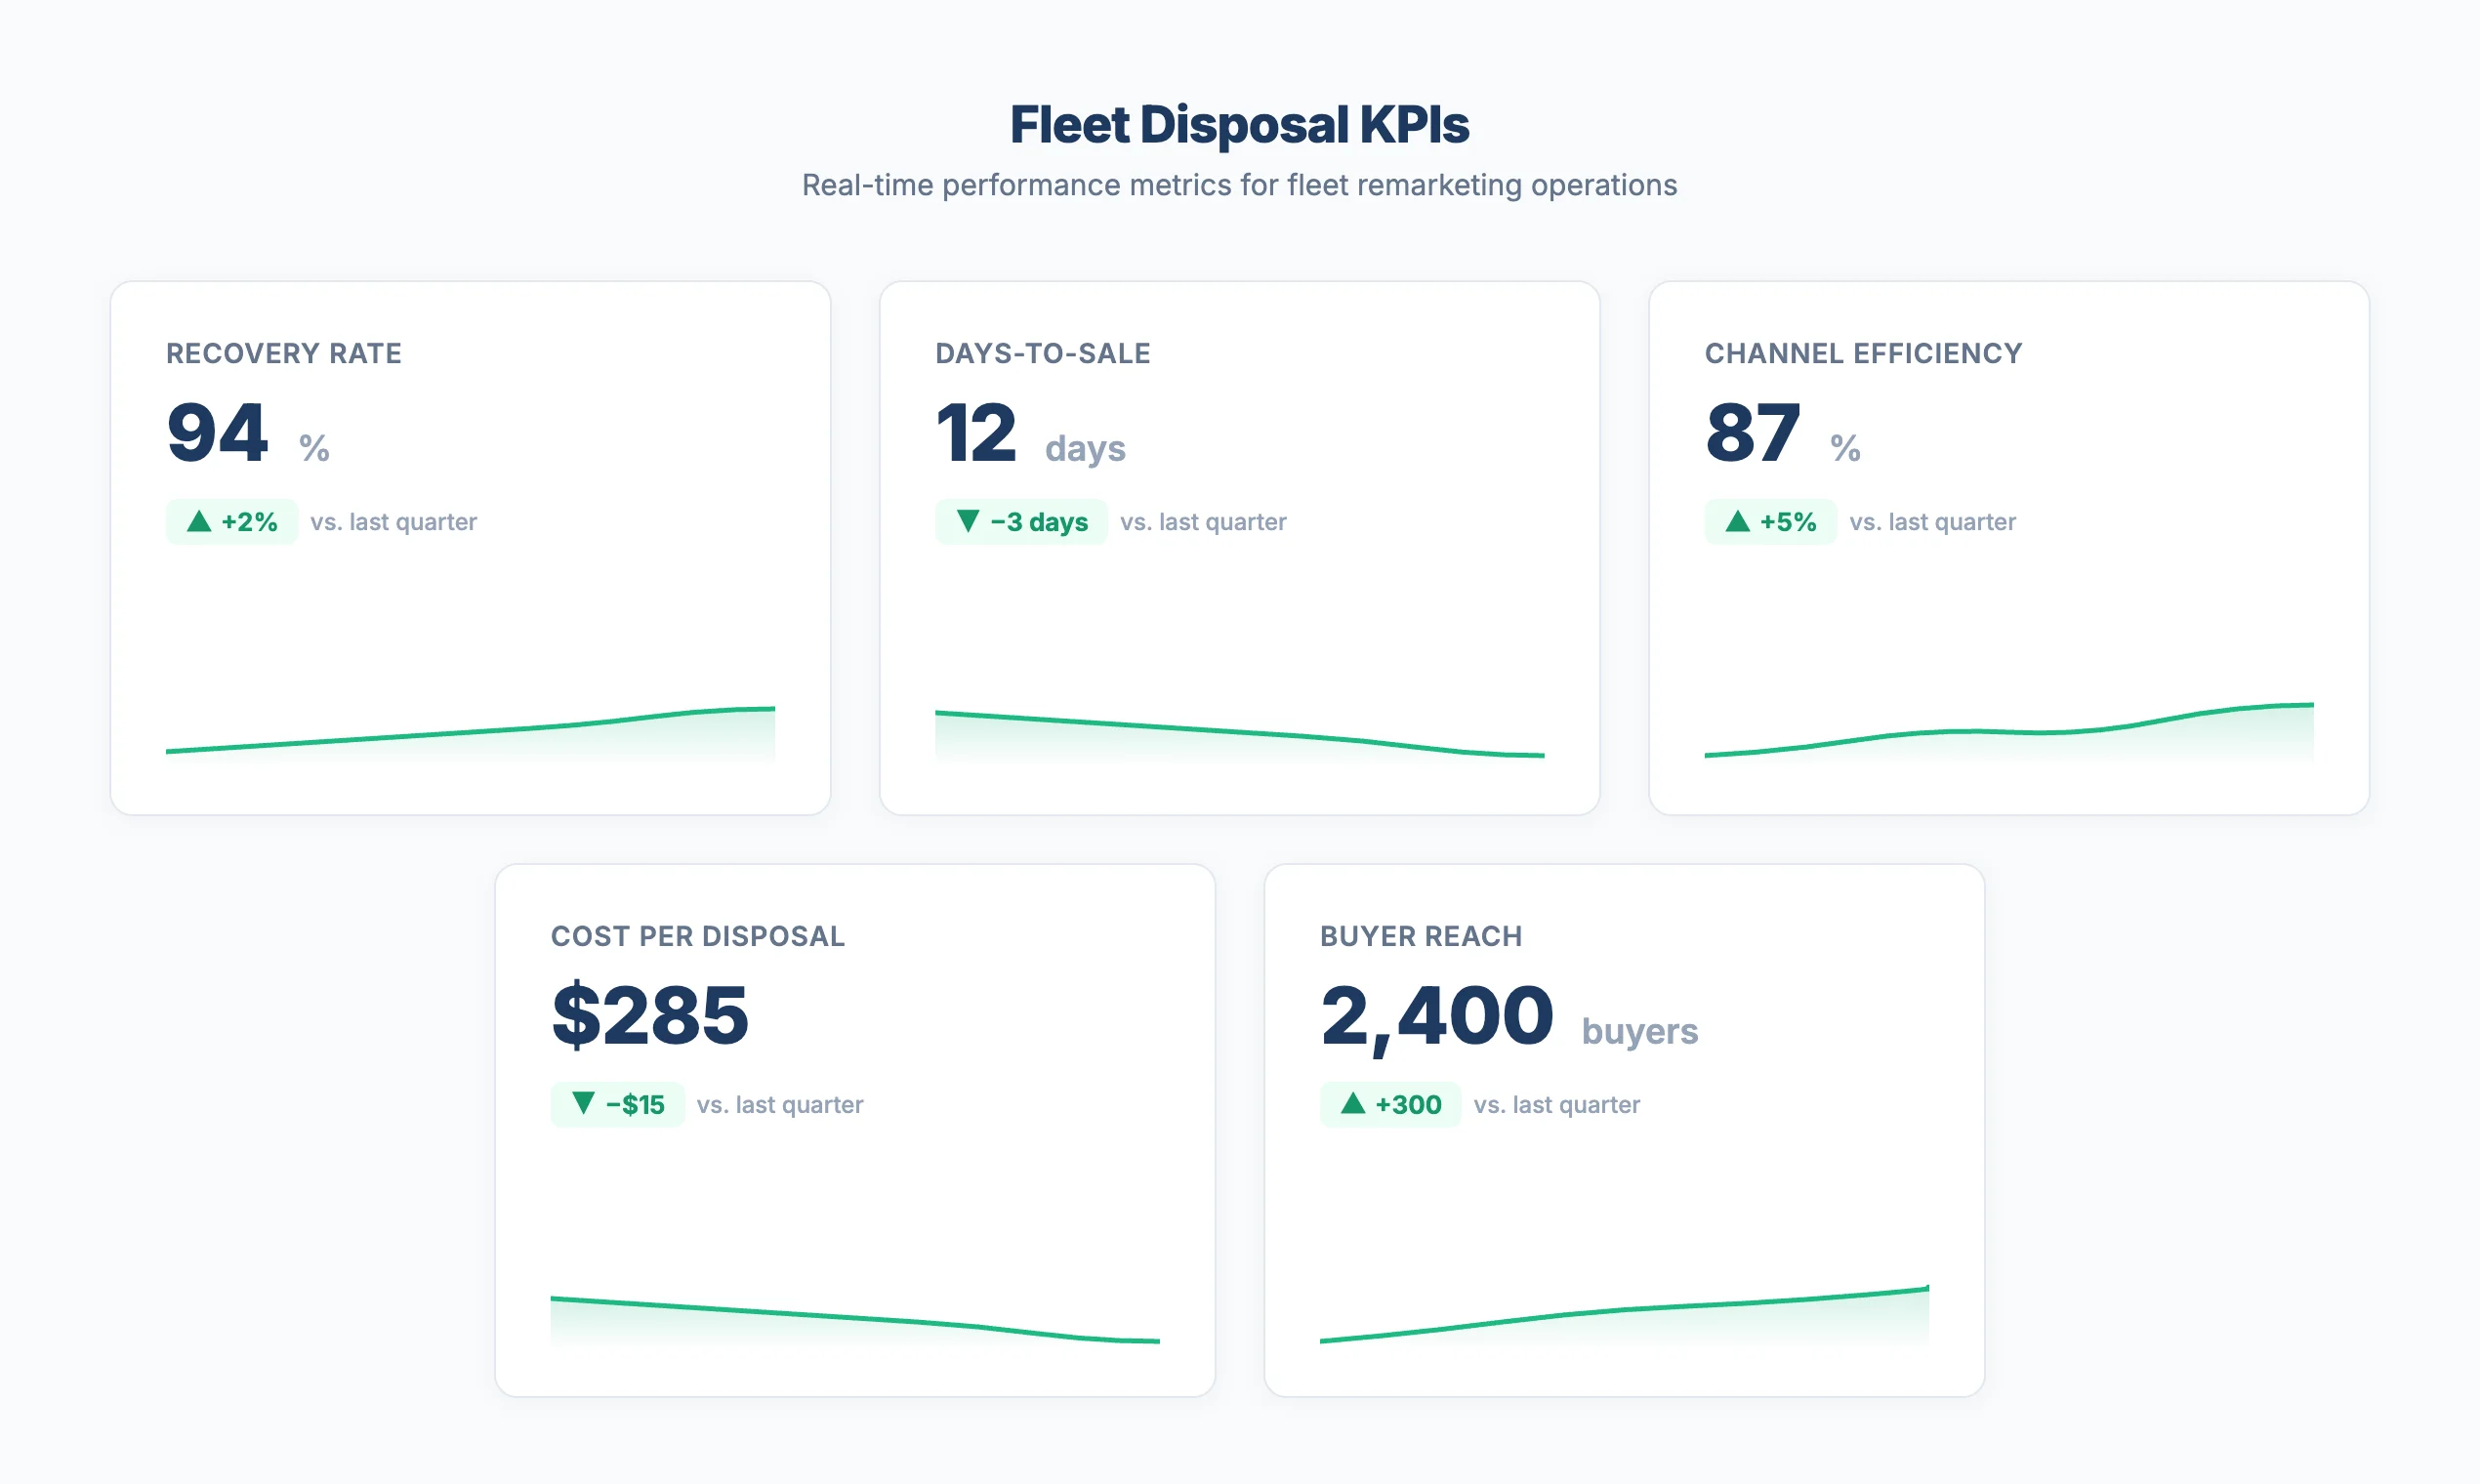 Five KPIs that separate high-recovery fleet disposal from reactive remarketing.
The EV Disposal Challenge
Electric vehicles present distinct remarketing challenges that require separate disposal strategies. EVs retain approximately 38% of their original value after three years, compared to 57% for ICE vehicles — a 19-percentage-point gap that directly compresses recovery rates. Average days-to-sale for EVs runs 11 days versus five for ICE, extending holding costs and tying up disposal pipeline capacity.
The volume pressure is accelerating. EV lease returns are projected to surge 200%+ in 2026 as three-year lease terms from 2023 reach maturity. Fleet operations that apply ICE-era disposal assumptions to EVs will see recovery rates fall below benchmarks across their entire portfolio. Treating EVs as a separate vehicle segment with dedicated KPI tracking is essential.
Five adjustments for EV disposal:
- Set separate recovery benchmarks — apply 38% three-year retention baseline rather than the 57% ICE standard when forecasting residual values
- List earlier in the lifecycle — EV depreciation curves are steeper in years two and three; consider disposal at 24 months rather than 36
- Document battery state-of-health (SOH) — buyer confidence and willingness to bid depend on verified battery condition data
- Target EV-specialist buyer networks — platforms with concentrated EV buyer pools generate more competitive bidding than generalist channels
- Track EV days-to-sale separately — blending EV and ICE metrics in a single days-to-sale number masks the 11-day versus five-day gap
Common Mistakes That Erode Recovery
-
Single-channel dependency. Relying on one platform limits buyer competition and eliminates the ability to match vehicle types to channel strengths. A multi-channel approach yields approximately $4,000 per vehicle in combined savings through competitive bidding and channel-optimized placement. Fleet operations using a single channel leave that margin on the table with every transaction.
-
Skipping vehicle preparation. Every $1 spent on reconditioning returns $2–$3 in recovery value. A $200 basic reconditioning investment on a 500-vehicle fleet costs $100,000 and returns $200,000–$300,000 in incremental recovery. Condition reports with 20+ photos expand buyer reach from 35 miles to 95 miles — more bidders means higher hammer prices.
-
Ignoring seasonality. The $2,800 per-vehicle pricing swing between peak (Q1–Q2) and trough (Q3) quarters represents $1.4 million in recovery value across a 500-vehicle fleet. Disposing vehicles on an administrative schedule rather than a market-aligned schedule absorbs this loss as a hidden cost.
-
Not tracking per-vehicle recovery rates. Aggregate recovery metrics mask underperformance in specific vehicle segments, channels, or seasons. A fleet may report 90% overall recovery while EVs recover at 70% and a secondary channel consistently underperforms by 8%. Per-vehicle, per-channel, per-segment tracking surfaces these problems before they compound.
Recommended Platform Features for Fleet Scale
Fleet disposal operations handle volume that exceeds what most dealer-focused platform features are designed for. Evaluate platforms against the following criteria before committing fleet volume. The Platform Selection Guide provides detailed comparisons across regions.
Platform Features to Evaluate for Fleet-Scale Disposal
0 of 10 completedDisposal Cost Estimation Template
Use this worksheet before setting reserves to calculate expected net recovery for each vehicle. Work from expected hammer price downward, subtracting each cost line to arrive at the net recovery figure. Compare against book value to determine whether the vehicle meets your recovery rate threshold.
For an interactive version that calculates net recovery automatically, use the Net Proceeds Calculator.
Frequently Asked Questions
How many disposal channels should a fleet operation use?
Two to three channels provide sufficient buyer competition without fragmenting operations. Assign each channel a vehicle segment based on its buyer network strength — one channel may perform well for sedans and SUVs while another has deeper demand for commercial vehicles or EVs. A multi-channel approach yields approximately $4,000 per vehicle in combined savings compared to relying on a single platform, based on competitive bidding dynamics and channel-optimized placement.
What recovery rate should fleet managers target?
Target 85–95% of book value as the overall fleet benchmark, but segment the metric by vehicle type, age, and channel. A 90% aggregate rate that masks 70% EV recovery and 95% ICE recovery indicates a segment-specific problem, not a healthy portfolio. Track recovery rate monthly by segment and channel to identify where the operation underperforms and where disposal strategy adjustments are needed.
When is reconditioning worth the investment?
Reconditioning returns $2–$3 for every $1 spent, making it consistently positive-ROI for fleet disposal. Basic reconditioning ($200 per vehicle) is justified on nearly every unit. Comprehensive reconditioning ($1,000 per vehicle) is justified for vehicles with higher residual values where the incremental recovery exceeds the cost. For a detailed analysis of reconditioning ROI thresholds by vehicle type, see the Reconditioning ROI guide and the Reconditioning ROI Calculator.
How should fleet managers handle EV disposal differently?
Treat EVs as a separate disposal segment with dedicated KPI benchmarks. Set residual expectations using the 38% three-year retention baseline rather than the 57% ICE standard. Document battery state-of-health for every listing. Consider earlier lifecycle disposal (24 months rather than 36) to avoid the steeper depreciation curve. Track EV days-to-sale separately — the 11-day average versus five for ICE distorts blended metrics and masks the true operational difference.
What is the optimal time of year to dispose of fleet vehicles?
Q1 and Q2 capture peak wholesale demand, with pricing running 3–5% above baseline. The $2,800 per-vehicle swing between peak and trough quarters translates to $1.4 million in recovery value across a 500-vehicle fleet. Front-load disposal volume into January through June when tax refund spending and dealer spring stocking drive demand. Hold premium vehicles through Q3 if feasible, and use Q4 to clear remaining cycle-end inventory before year-end.
Putting the Playbook Into Practice
The seven-step workflow, five KPI benchmarks, and seasonality data in this playbook provide the structure for measurable fleet disposal performance. Start by running the Inventory Aging Risk Score on your current fleet to identify vehicles where holding costs exceed remaining residual value. Use the Platform Directory to evaluate channels against the fleet features checklist, and complete the Auction Readiness Checklist before your next disposal cycle.
The margin gains come from applying the process consistently — calculating net recovery before setting reserves, preparing vehicles for the widest buyer reach, timing disposals to seasonal demand, and tracking per-vehicle recovery rates by channel and segment. Feed every cycle’s data back into the next fleet assessment.