
Why Auction Sourcing Needs a System
NAAA members sold 7.6 million vehicles in 2024, generating $105 billion in gross wholesale sales at an average price of $13,921 per unit. That volume represents the single largest wholesale inventory channel for dealers in North America and Europe. Yet the margin available on each of those vehicles continues to shrink — used vehicle gross profit fell from 7.3% in 2019 to 5.4% in Q2 2025.
At 5.4% gross margin, a single overbid, a missed condition report defect, or three extra days of holding costs can erase profit entirely. Dealers who treat auction sourcing as an ad-hoc activity absorb these losses repeatedly. This playbook provides a structured, repeatable workflow — from platform selection through reconditioning — designed to protect margin on every vehicle purchased at a timed auction, live auction, or simulcast event.
 A disciplined sourcing workflow is the foundation of profitable auction buying.
The 8-Step Auction Sourcing Workflow
The following workflow covers the full sourcing cycle, from identifying platforms through retail-ready preparation. Each step builds on the previous one. Skipping steps — particularly pre-bid cost calculation and post-purchase inspection — is where margin compression occurs.
Research platforms
Identify two to three B2B auction platforms that match your inventory needs. Filter by auction format (timed, live, simulcast), fee model, and inventory depth. Use the Platform Directory to compare options across regions.
Register and get approved
Complete dealer verification, submit business licenses, and set up payment. Registration typically takes 3–7 business days. Choose wire or ACH payment to avoid the 1–3% credit card processing fee that erodes margin on every transaction.
Set buying criteria
Define your target vehicle profile before browsing inventory. Specify make/model, year range, mileage cap, minimum condition grade, and maximum landed cost. Document these criteria so every team member bids from the same parameters.
Browse and bid
Review condition reports, photos, and vehicle history for each candidate. Calculate your maximum bid using the landed cost formula. Bid only on vehicles that meet your documented criteria — discipline here determines margin downstream.
Win the auction
Confirm the purchase, arrange payment within 24–48 hours, and initiate title processing. Delays at this stage trigger storage fees and extend your days-to-sale metric.
Inspect on receipt
Verify the vehicle against its condition report within the arbitration window (3–10 days depending on platform). Document any discrepancies with timestamped photos. File arbitration claims immediately if the vehicle does not match the listed condition.
Arrange transport
Book transport the day you win. Every day between winning and receiving a vehicle adds $40–$85 in holding costs (storage, insurance, floor plan interest). Pre-negotiate rates with two to three carriers for predictable costs.
Recondition and sell
Budget approximately $1,112 for average reconditioning. Target selling within 24–30 days of purchase. Price using a cost-to-market ratio of 84–88% to balance margin against turn rate.
Calculating Landed Cost Before You Bid
Landed cost is the total of every expense incurred from hammer price through retail readiness. The gap between hammer price and true acquisition cost typically ranges from 15–25%, depending on platform fees, distance, and vehicle condition. Dealers who calculate landed cost before bidding avoid the most common margin trap: winning a vehicle that cannot be sold profitably.
Every pre-bid calculation should include these cost components:
- Hammer price — the winning bid amount
- Buyer fee / buyer premium — 1–10% of hammer price, or a flat fee of $100–$500+
- Documentation and title fees — $25–$75 per vehicle
- Transport — $300–$800 for domestic shipment
- Reconditioning — approximately $1,112 average, though vehicles with undisclosed issues can exceed $3,000
- Holding costs — $40–$85 per day from purchase date through sale date (storage, insurance, floor plan interest)
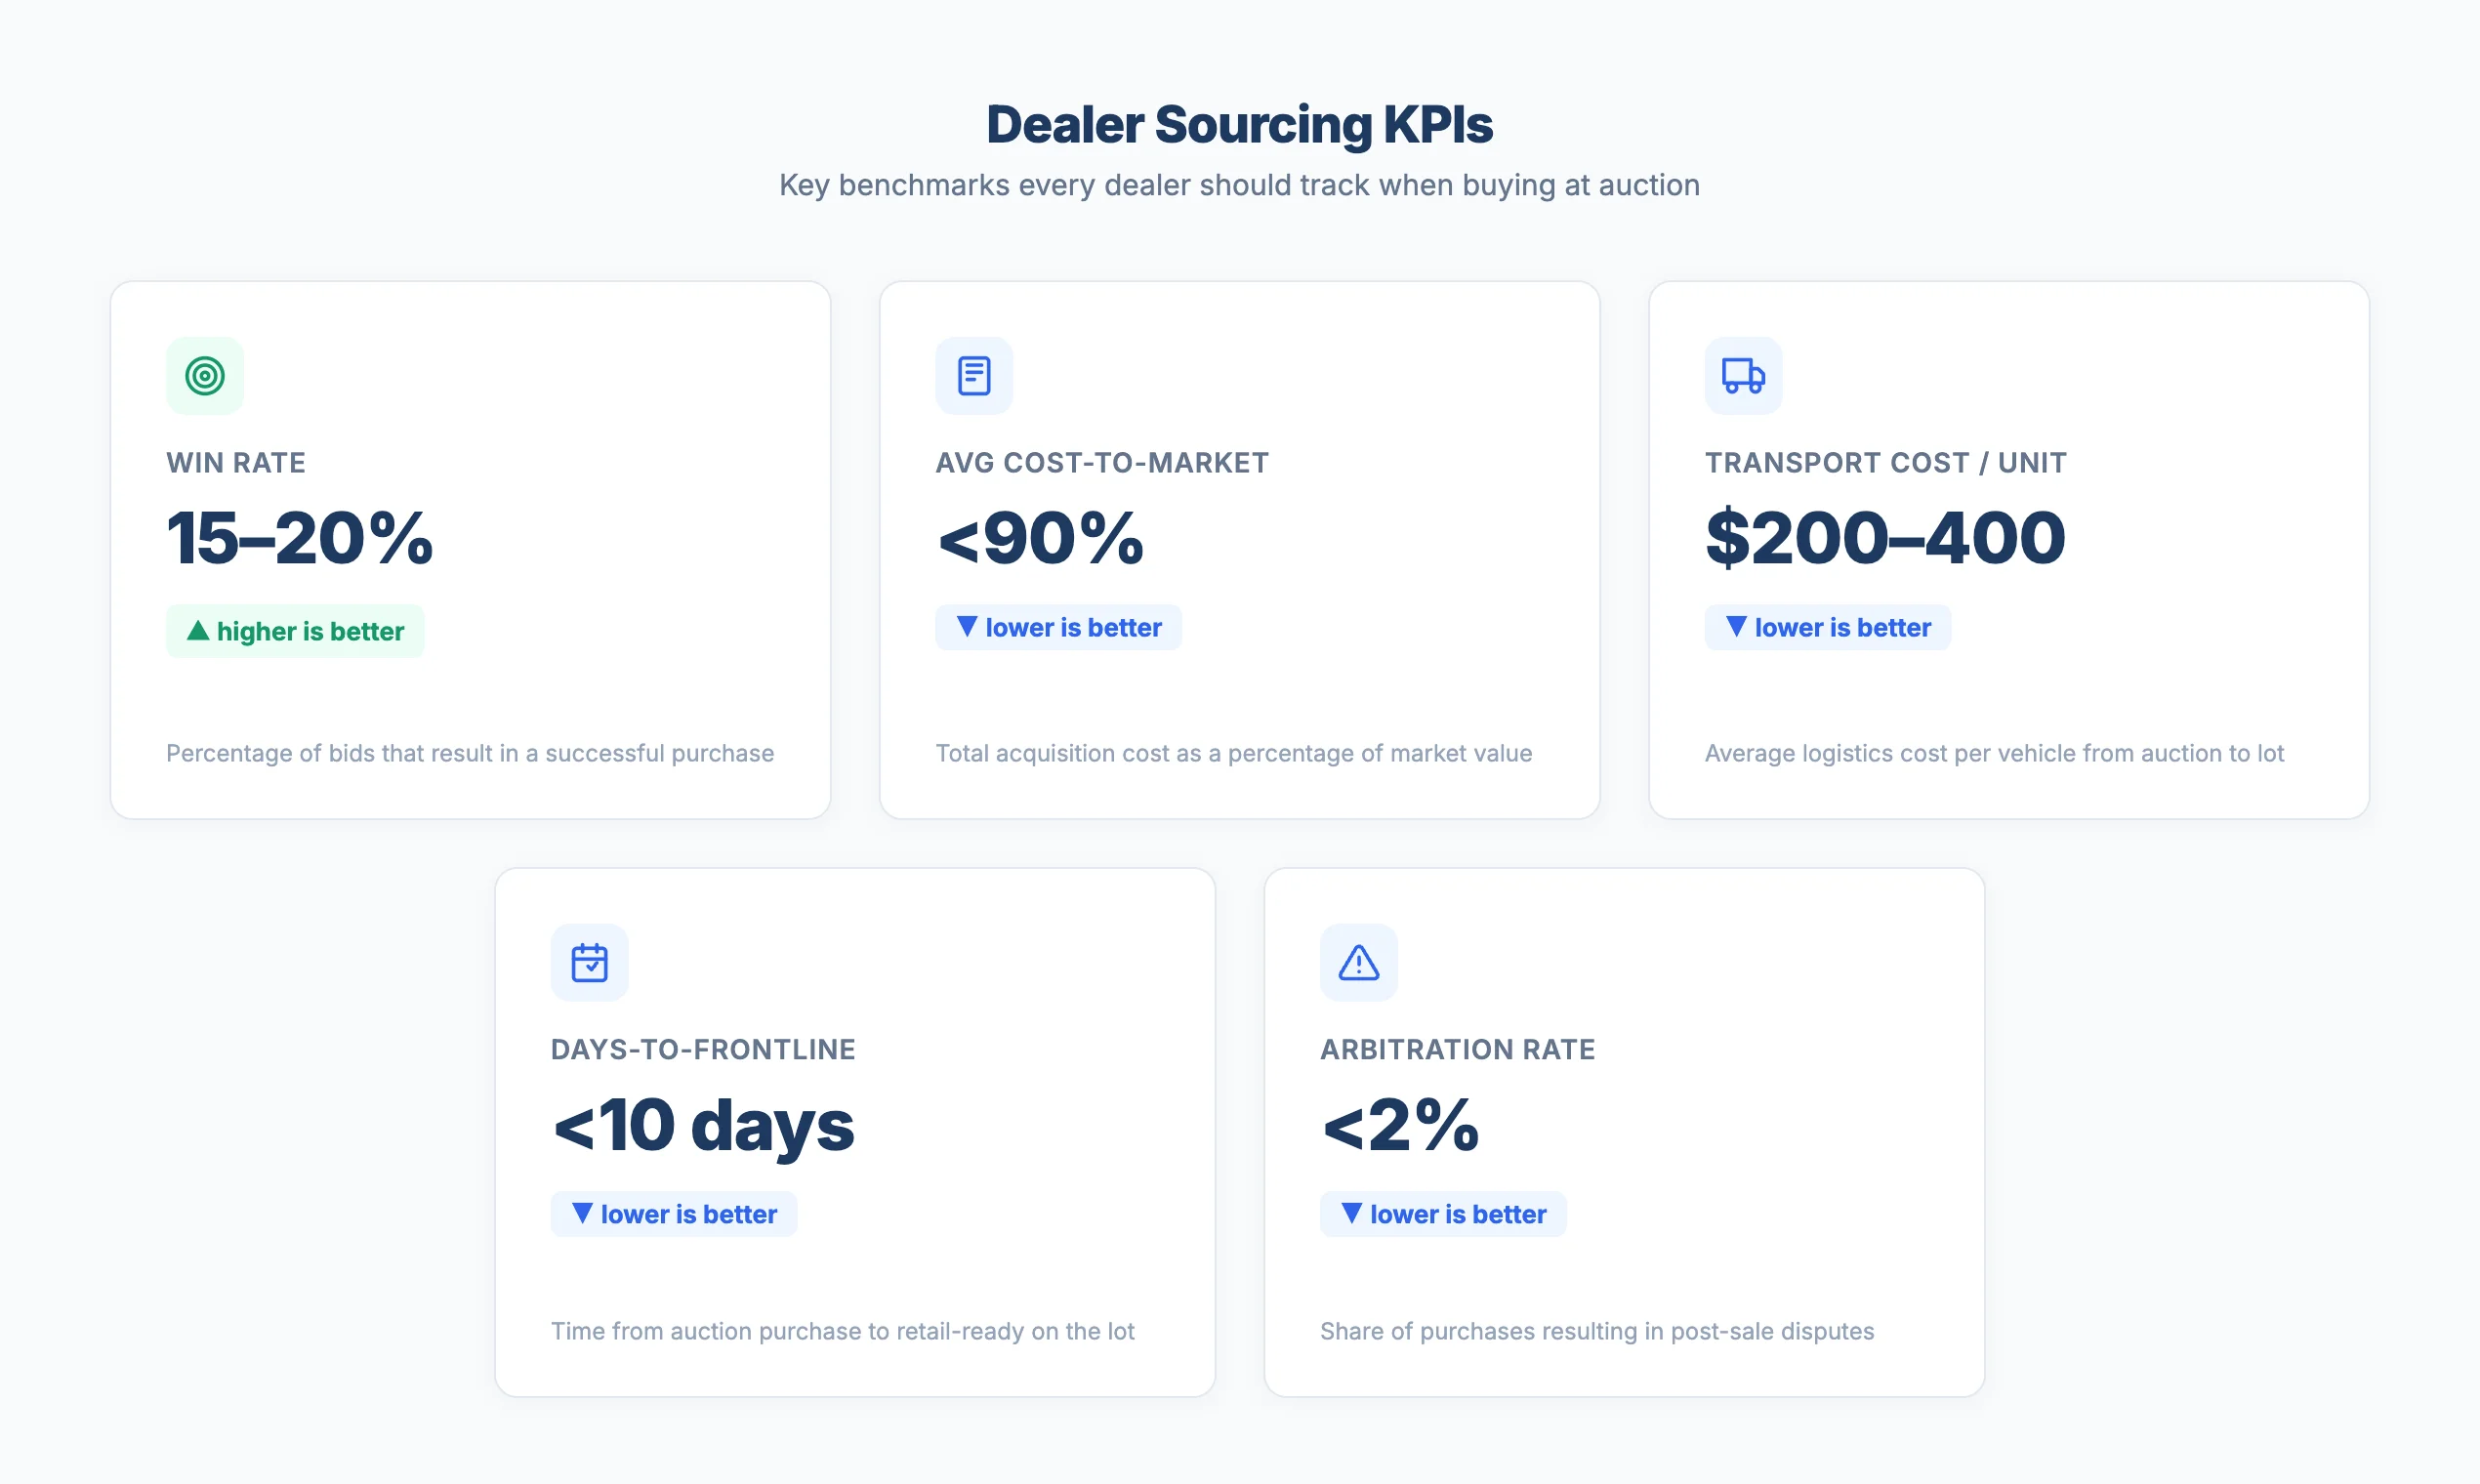
Dealer KPI Benchmarks
Five KPIs form a closed feedback loop for auction sourcing performance. Track each one weekly to identify problems before they compound across your inventory.
| KPI | Benchmark | Why It Matters | How to Track |
|---|---|---|---|
| Cost per Acquisition | 84–88% cost-to-market | Above 88% signals overbidding or underestimating fees | (Hammer + fees + transport + recon) / retail market price |
| Gross Margin per Vehicle | $1,668 / 5.4% (Q2 2025) | Compressed from 7.3% in 2019; every dollar of unnecessary cost erodes this margin | (Sale price − total cost) / sale price |
| Inventory Turn Rate | 12–15 turns per year | Higher turns compound profit; slow turns accumulate holding costs | Vehicles sold per year / average inventory count |
| Arbitration Rate | Under 5% of purchases | High rates indicate inadequate condition report review before bidding | Arbitration claims filed / total vehicles purchased |
| Days from Purchase to Sale | Under 37 days | Every extra day adds $40–$85 in holding costs | Date vehicle sold − date vehicle purchased |
These five metrics connect directly: cost-to-market and gross margin measure buying discipline, turn rate and days-to-sale measure operational speed, and arbitration rate measures condition report diligence. The target gross return on investment (GROI) is 156 — calculated as 13% gross margin multiplied by 12 inventory turns per year. Dealers who hit this benchmark generate consistent profit even in a compressed-margin environment.
 Five KPIs that separate profitable auction sourcing from reactive buying.
Common Mistakes That Erode Margin
-
Overbidding without calculating landed cost. A vehicle won at $12,000 with $2,400 in total fees and reconditioning costs $14,400 to land. If the retail market price is $15,000, gross margin is only 4% — below the 5.4% average and dangerously close to break-even. Use the Break-Even / Max Bid Calculator to set a firm ceiling before every bid.
-
Ignoring condition reports. Average reconditioning costs $1,112, but vehicles with missed mechanical or structural issues can exceed $3,000. Dealers who skim condition reports or skip the photos absorb these surprises after the arbitration window closes. Review every report line by line, and compare photos against the written description.
-
Spreading volume across too many platforms. Using five or six platforms prevents qualification for volume-tier fee discounts on any of them. Consolidate 60–70% of purchases on one primary platform to unlock lower buyer fees and earn dedicated account manager support. Use one to two secondary platforms for inventory gaps only.
-
Missing arbitration windows. Arbitration windows range from three to 10 days depending on the platform and issue type. Missing the deadline forfeits your right to a claim, regardless of how severe the discrepancy. Set calendar reminders on the day of purchase for every vehicle, and inspect within 48 hours of receipt.
Platform Features Checklist
Not every platform suits every dealer operation. Before committing volume to a platform, evaluate it against the 10 features that most directly affect sourcing efficiency and cost control.
Platform Features to Evaluate Before Committing Volume
0 of 10 completedAny platform handling 30% or more of your purchase volume should meet at least seven of these 10 criteria. Platforms that fall short on fee transparency, condition report quality, or arbitration terms create risk that compounds across every vehicle purchased. For a detailed comparison of platform capabilities across regions, see the Platform Selection Guide.
Pre-Bid Calculation Template
Use this worksheet before every auction session to calculate your maximum bid. Fill in the target sale price first, then subtract each cost line to arrive at the ceiling bid that preserves your margin.
For an interactive version that calculates your maximum bid automatically, use the Break-Even / Max Bid Calculator. Enter your target sale price, estimated costs, and minimum acceptable margin to generate a firm bid ceiling.
Frequently Asked Questions
How many auction platforms should a dealer use?
Two to three platforms provide sufficient inventory depth without diluting volume discounts. Designate one primary platform for 60–70% of purchases to qualify for volume-tier fee reductions and earn dedicated account support. Use one to two secondary platforms to fill specific inventory gaps — niche vehicle types, regional availability, or buy-now inventory that your primary platform does not carry.
What is a good cost-to-market ratio?
Target 84–88% cost-to-market on every acquisition. This means your total landed cost (hammer price plus all fees, transport, and reconditioning) should not exceed 84–88% of the vehicle’s expected retail market price. Above 88% leaves insufficient margin to absorb holding costs and market price fluctuations. Below 84% is achievable but typically requires off-lease or high-mileage inventory with lower competition.
How do I reduce buyer fees?
Four strategies reduce buyer fees measurably. First, consolidate volume on fewer platforms to qualify for higher account tiers. Second, negotiate annual fee contracts with your account manager using competing platform offers as leverage. Third, pay by wire or ACH to eliminate the 1–3% credit card surcharge. Fourth, use the Auction Fee Comparator to identify which platforms offer the lowest total cost for your vehicle mix and volume.
What should I do if a vehicle does not match the condition report?
File an arbitration claim within the platform’s arbitration window — typically three to 10 days from the purchase date. Document every discrepancy with timestamped photos and reference the specific condition report line items that do not match. Most platforms require photo evidence and a written description of the defect. Do not begin reconditioning on disputed items until the arbitration process resolves, as repairs can void your claim.
How do I track sourcing KPIs effectively?
Track the five KPIs from the benchmarks table (cost-to-market, gross margin, turn rate, arbitration rate, days-to-sale) in a spreadsheet or your DMS. Update after every purchase and sale. Review weekly with your buying team to identify trends — a rising cost-to-market signals overbidding, a climbing days-to-sale number indicates pricing or reconditioning delays, and an arbitration rate above 5% means condition reports need closer review before bidding.
Auction Day Quick-Reference
Print this checklist or keep it open on your phone during auction sessions. Every item should be confirmed before placing a bid.
Auction Day Quick-Reference Checklist
0 of 7 completedPutting the Playbook Into Practice
Profitable auction sourcing is a function of process discipline, not market timing. The eight-step workflow, five KPI benchmarks, and pre-bid calculation template in this playbook provide the structure. The margin gains come from applying them consistently — calculating landed cost before every bid, reviewing condition reports thoroughly, consolidating volume for fee leverage, and measuring results weekly against the benchmarks.
Start by running the Landed Cost Calculator on your last 10 purchases to establish your current cost-to-market baseline. Compare your buyer fees across platforms with the Auction Fee Comparator, and use the Net Proceeds Calculator when evaluating sell-side opportunities. The Platform Directory provides detailed profiles of B2B auction platforms across regions to help identify where to consolidate or expand your sourcing.