
Why Auction Platform Choice Matters
Approximately 22 million wholesale vehicles change hands annually in the United States, representing a market worth roughly $230 billion. NAAA member auctions alone moved 7.6 million vehicles in 2024 at a 61.3% conversion rate. Every one of those transactions carried fees, transport costs, and operational overhead shaped by the auction platform where it occurred.
Platform choice determines four things: what inventory you access, how much you pay above the hammer price, how many buyers compete for your listings, and how efficiently your team processes transactions. Total costs above hammer price typically run 15–25% when factoring buyer premiums, documentation fees, transport, and storage. Across hundreds of transactions per year, a 3–4% difference in per-vehicle cost translates to tens of thousands of dollars.
Choosing a platform is not a one-time decision. Market conditions shift, fee structures change, and your own business volume evolves. This guide provides a systematic framework — eight evaluation criteria, a scoring matrix, and profile-based recommendations — to make that decision with data rather than habit.
Eight Criteria for Evaluating Auction Platforms
Platform selection involves multiple variables that interact differently depending on your business model. A fleet operator disposing of 500 units per month weights criteria differently than an independent dealer sourcing 20. The following eight criteria provide a structured framework for comparison.
- Inventory alignment — Does the platform carry the vehicle types, age ranges, and condition categories you need?
- Geographic coverage — Does it serve the regions where you buy, sell, or transport vehicles?
- Fee structure — What are the total per-vehicle costs, including ancillary fees beyond the headline rate?
- Technology and UX — Does the platform support mobile bidding, condition reports, and the auction formats you use?
- Volume requirements — Are there minimum transaction thresholds, and do volume tiers align with your scale?
- Buyer/seller network — How many active participants compete on listings, and does that match your goals?
- Integration capabilities — Does the platform connect to your DMS, accounting system, or transport providers?
- Support and service — What level of account management, dispute resolution, and onboarding assistance does the platform provide?
Each criterion carries different weight depending on your role. Sections below address buyer fee and seller fee structures, technology capabilities, and profile-based recommendations in detail.
Fee Structures: What You Actually Pay
Buyer-Side Fees by Platform
Fee structures vary significantly across platforms and regions. The table below compares buyer-side costs at six major B2B platforms.
| Platform | Buyer Fee / Vehicle | Fee Model | Storage Grace Period | Storage Daily Rate |
|---|---|---|---|---|
| Manheim | $300–$600+ | Tiered by volume | 2–3 business days | $15–$35/day |
| ADESA / OPENLANE | $300–$600+ | Tiered by volume | 2–3 business days | $15–$40/day |
| ACV Auctions | ~$360 avg | Flat per vehicle | N/A (dealer-to-dealer) | N/A |
| BacklotCars | ~$100–$150 | Flat per vehicle | N/A (dealer-to-dealer) | N/A |
| BCA (UK/EU) | Tiered schedule | Percentage of hammer | Varies by site | $10–$30/day |
| Autorola (EU) | $160–$250 | Flat per vehicle | Seller-managed | Seller-managed |
Two fundamental fee models exist: flat-rate and percentage-based. US platforms predominantly use flat fees tiered by hammer price, keeping costs more predictable. European platforms like BCA charge a percentage — up to 14% for standard-tier accounts — meaning high-value vehicles carry proportionally higher fees. Understanding which model a platform uses determines how fee costs scale with your vehicle mix.
The headline buyer premium is never the full cost. Documentation fees ($25–$75), transport arrangement fees ($50–$150), and storage charges ($10–$50/day after grace period) inflate the real per-vehicle cost by 15–25% above hammer. A platform advertising a “$300 fee” may cost $500+ per vehicle once ancillary charges are included.
Compare total per-vehicle costs — not headline fees — using the Auction Fee Comparator. For a deeper breakdown of every fee category, see the auction fees guide. Understanding listing fee structures on the seller side is equally important when evaluating platforms for remarketing.
Technology, UX, and Integration
Technology capabilities determine operational efficiency, especially at scale. A platform with strong mobile UX and reliable condition reports reduces time per transaction. API access and DMS integration matter when processing 100+ vehicles per month.
| Capability | Manheim | ADESA / OPENLANE | ACV Auctions | BCA | Autorola |
|---|---|---|---|---|---|
| Mobile bidding app | Yes | Yes | Yes | Yes | Yes |
| Simulcast | Yes | Yes | No (timed only) | Yes | No (timed only) |
| DMS integration | OVE / vAuto / major DMS | OPENLANE Connect | Limited | BCA Partner Connect | API available |
| Condition report standard | Manheim MMR + CR | AutoGrade | ACV TrueFrame | BCA Assured | Seller-provided |
| API access | Enterprise only | Enterprise only | Open API | Partner program | Open API |
| Arbitration window | 7–10 days | 7–10 days | 7 days | 3–5 days | Varies |
Technology matters most for high-volume operations where seconds per transaction multiply across hundreds of vehicles. Smaller dealers prioritize mobile UX and condition grade quality over API access — the ability to review accurate vehicle condition from a phone determines bidding confidence more than backend integration.
For operations that mix auction formats — live, simulcast, and timed — platform format support matters. Simulcast capability lets dealers bid remotely on live sales, expanding inventory access without travel. Timed auction platforms like ACV and Autorola suit operations that prefer asynchronous bidding over fixed-time sessions. The auction types guide covers format selection in detail. For a deeper side-by-side breakdown of technology, integration, and service features across platforms — mapped to four business types — see the platform feature comparison.
Which Platform Fits Your Business?
No single platform serves all business profiles equally. The four profiles below map common operational characteristics to platform strengths.
Small Independent Dealer (Under 50 Units/Month)
- Priority: Low fees, easy onboarding, mobile-friendly interface
- Fit: ACV Auctions, BacklotCars, regional digital platforms
- Key metric: Per-vehicle cost at the $8,000–$15,000 price point
- Watch out for: Volume minimums that negate fee savings if you fall below the threshold
Large Dealer Group (200+ Units/Month)
- Priority: DMS integration, enterprise pricing, geographic reach across multiple stores
- Fit: Manheim, ADESA/OPENLANE with negotiated rates
- Key metric: Blended fee rate across all stores and vehicle types
- Watch out for: Over-reliance on a single platform, which reduces negotiating leverage at renewal
Fleet or Leasing Company (500+ Units/Month)
- Priority: Sell-through rate, remarketing services, buyer network depth
- Fit: Manheim, BCA, OPENLANE with dedicated account management
- Key metric: Conversion rate and days-to-sale
- Watch out for: No-sale fees eroding margins on hard-to-sell units — at $75 per no-sale, a 60% conversion rate on 500 vehicles costs $15,000/month in no-sale fees alone
Remarketing Service Provider
- Priority: Multi-channel flexibility, white-label options, analytics and reporting
- Fit: Multi-platform strategy combining two to three platforms for different vehicle segments
- Key metric: Net proceeds per vehicle across channels
- Watch out for: Platform exclusivity clauses in seller agreements that restrict multi-channel listings
Use the Remarketing Channel Mix Calculator to model how volume allocation across platforms affects total net proceeds.
Build Your Own Comparison Matrix
A weighted scoring matrix converts subjective platform impressions into quantifiable comparisons. Assign each of the eight criteria a weight (totaling 100%), score each platform on a 1–5 scale, then multiply scores by weights to produce a weighted total. The platform with the highest total is your strongest fit — assuming the data behind the scores comes from real experience, not marketing material.
Below is a completed example for a mid-size dealer group processing 80 vehicles per month, evaluating three platforms with fee structure and integration weighted highest.
| Criterion (Weight) | Manheim (Score) | ACV Auctions (Score) | Autorola (Score) |
|---|---|---|---|
| Inventory Alignment (20%) | 5 (1.00) | 4 (0.80) | 3 (0.60) |
| Geographic Coverage (10%) | 5 (0.50) | 4 (0.40) | 3 (0.30) |
| Fee Structure (20%) | 2 (0.40) | 4 (0.80) | 4 (0.80) |
| Technology & UX (15%) | 4 (0.60) | 5 (0.75) | 4 (0.60) |
| Volume Requirements (5%) | 3 (0.15) | 5 (0.25) | 4 (0.20) |
| Buyer/Seller Network (15%) | 5 (0.75) | 3 (0.45) | 3 (0.45) |
| Integration (10%) | 4 (0.40) | 3 (0.30) | 4 (0.40) |
| Support & Service (5%) | 4 (0.20) | 3 (0.15) | 3 (0.15) |
| Weighted Total | 4.00 | 3.90 | 3.50 |
When and How to Use Multiple Platforms
Approximately 50% of simulcast vehicles are now purchased online rather than in-lane. Professional buyers and sellers routinely work across two to three platforms to access broader inventory, diversify risk, and maintain negotiating leverage. A structured multi-platform approach prevents the overhead of managing too many channels while capturing the benefits of diversification.
Designate a primary platform
Choose one platform for 60–70% of your volume. Negotiate the strongest fee tier, build account history, and establish relationships with the account management team.
Add a complementary secondary
Fill gaps your primary does not cover: different geography, vehicle mix, or auction format. A timed auction platform complements a simulcast-focused primary, and vice versa.
Add specialty channels for niche inventory
Salvage, luxury, commercial, or cross-border inventory often moves through dedicated platforms. These may handle only 10–15% of your total volume but serve segments your primary cannot.
Centralize tracking and reporting
Maintain a single spreadsheet, DMS module, or reporting tool that tracks costs, conversion rates, and net proceeds across all platforms. Without centralized data, multi-platform strategy becomes multi-platform chaos.
Review allocation quarterly
Shift volume toward platforms delivering the strongest net proceeds. Renegotiate fees annually using competitive data from your secondary platforms as leverage.
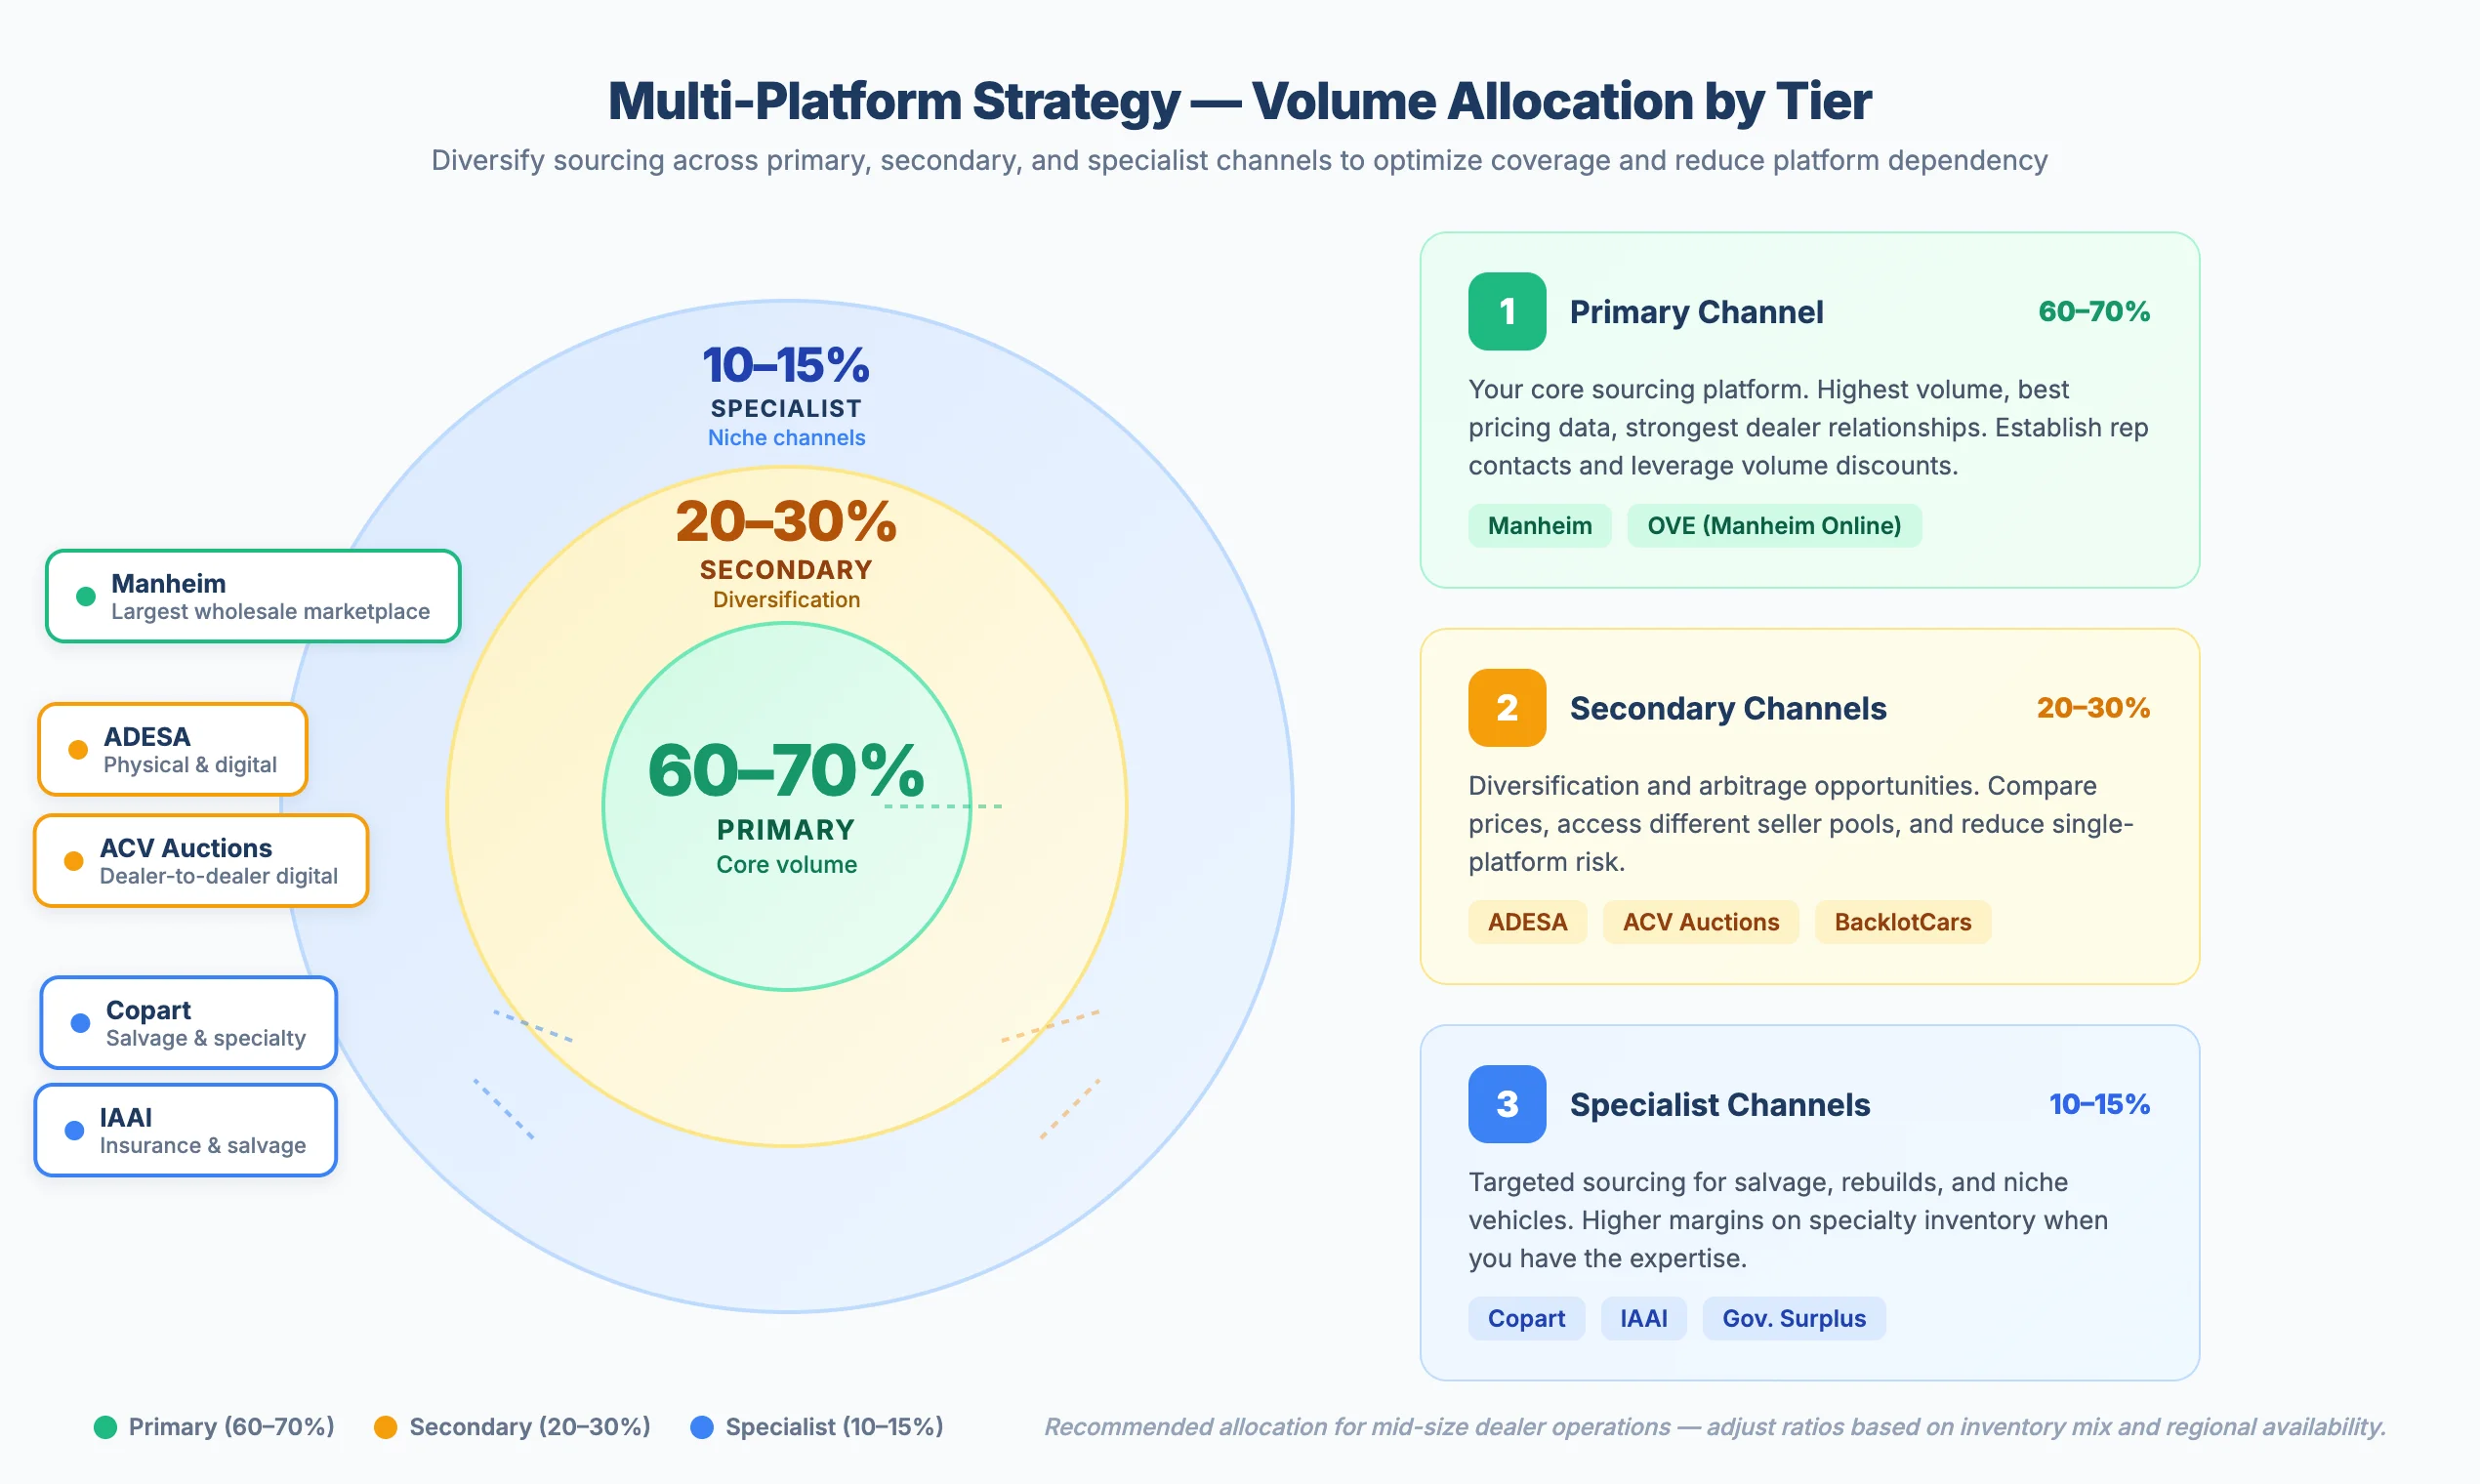 A tiered multi-platform strategy balances fee negotiation leverage with inventory access diversity.
A multi-platform approach also reduces concentration risk. If your primary platform experiences outages, policy changes, or fee increases, having established accounts elsewhere lets you redirect volume without starting from zero. Model your optimal allocation using the Net Proceeds Calculator and the Landed Cost Calculator to compare net outcomes across platforms.
Red Flags: When to Walk Away
Due diligence before committing volume to a platform prevents costly surprises. The checklist below covers the verification steps that separate reliable platforms from problematic ones.
Platform Due Diligence Checklist
0 of 10 completedThree warning signs warrant immediate caution. Platforms that refuse to provide a written fee schedule before you commit volume are hiding unfavorable terms. Arbitration windows under 48 hours leave insufficient time to inspect vehicles and file legitimate claims — the industry standard is seven to 10 days. Platforms without NAAA membership (in the US) or equivalent industry association affiliation lack the accountability structure that protects participants.
Start with five to 10 transactions to validate real-world performance before routing significant volume. Condition report accuracy, title processing speed, and support responsiveness reveal themselves only through actual use. The arbitration claims guide details what to look for in platform dispute policies.
Migrating Between Platforms
Switching platforms — or shifting volume from one to another — requires a structured transition to avoid disruption. Abrupt migration risks title processing gaps, payment workflow failures, and lost transaction history.
Audit current platform costs
Pull six to 12 months of transaction data. Calculate your true all-in cost per vehicle, including buyer premiums, ancillary fees, storage charges, and arbitration costs. This baseline is your comparison benchmark.
Run a parallel trial
Allocate 10–20% of your volume to the new platform for 60–90 days. Compare conversion rates, net proceeds, condition report quality, and support responsiveness against your baseline.
Negotiate exit terms
Review your current contract for early termination fees, volume shortfall penalties, and data export restrictions. Note auto-renewal opt-out windows — many contracts renew automatically 30–60 days before expiration.
Plan the transition timeline
Shift volume gradually on a 30/60/90-day ramp. Ensure title processing workflows, payment routing, and transport logistics are fully established on the new platform before routing significant volume.
Conduct a 90-day post-migration review
Compare the first quarter on the new platform against your audited baseline. Evaluate per-vehicle cost, conversion rate, days-to-sale, and dispute frequency. Adjust volume allocation based on results.
Use the Break-Even / Max Bid Calculator to model how fee differences between old and new platforms affect your maximum bid thresholds. For dealers managing aged inventory during a transition, the inventory aging guide provides a framework for pricing vehicles that may sit longer during the changeover period.
Frequently Asked Questions
How many platforms should a dealer use?
Most dealers benefit from two to three platforms. Designate a primary platform for 60–70% of volume, a secondary for inventory diversity and negotiating leverage, and an optional specialist channel for niche segments like salvage or luxury. Managing more than three platforms creates administrative overhead that typically exceeds the marginal gains in inventory access.
What is a good conversion rate?
The NAAA average conversion rate was 61.3% in 2024. Well-run operations target 65–75%. Conversion rates consistently below 50% signal misaligned reserve price strategy, poor platform fit for the vehicle mix being listed, or inadequate condition reporting that reduces buyer confidence.
Can I negotiate auction fees?
Yes. Virtually all platforms negotiate fees for accounts with consistent volume. Thresholds for negotiation typically start at 50–100 vehicles per month. Even smaller dealers negotiate successfully by consolidating volume onto fewer platforms or committing to annual contracts that guarantee minimum transaction counts.
How do I compare different fee structures?
Use total-cost-per-vehicle as the comparison metric: hammer price plus buyer or seller fees, documentation fees, transport, and storage. Avoid comparing headline percentages across platforms with different fee models. The Auction Fee Comparator automates this calculation across multiple platforms simultaneously.
What is the most common platform selection mistake?
Choosing based solely on the lowest headline fee. The platform with the cheapest buyer premium may have lower conversion rates, less accurate condition reports, slower title processing, or a thinner buyer network. Total cost of ownership — including time spent resolving disputes, missed sales from poor buyer reach, and operational friction — is the correct evaluation metric, not the per-transaction fee alone.
Making Your Decision
Platform selection compounds across every transaction. On a single $14,000 vehicle, the fee difference between platforms may be $200–$400. Across 100 vehicles per month, that gap becomes $20,000–$40,000 annually — before factoring conversion rate differences, title processing delays, and dispute costs. The eight criteria, scoring matrix, and profile-based recommendations in this guide provide a systematic approach to a decision that too many dealers make by default or habit.
Start with the comparison matrix template. Score two to three platforms using real data from trial accounts — not feature lists or sales presentations. Run five to 10 transactions on each before committing volume. Use the cost calculators linked throughout this guide to quantify differences in total per-vehicle cost, and revisit your allocation quarterly.
Browse the full platform directory to identify candidates for your evaluation matrix, or filter by region to explore European auction platforms or North American platforms specifically. For a condensed starting point, read our blog post on choosing a B2B auction platform, see the cross-border buying guide if your sourcing or selling strategy extends across national borders, and explore regional versus pan-European platform differences if your operation spans multiple markets.