The Reconditioning Dilemma
Manheim’s certified reconditioning program averages a $2.27 return for every $1 spent — a figure widely cited as proof that reconditioning pays. That statistic is real, but it masks a critical detail: the $2.27 is an average across thousands of vehicles, and averages hide the cases where reconditioning destroyed value instead of creating it. Every reconditioning dollar spent on the wrong vehicle, at the wrong time, with the wrong scope is a dollar lost.
This guide provides a data-driven framework for the recondition-vs.-sell-as-is decision. It covers cost benchmarks by repair category, a step-by-step ROI calculation methodology, three worked examples showing the full profit-to-loss spectrum, platform condition grade systems, a decision matrix, and a pre-reconditioning checklist. The goal is to replace gut instinct with a repeatable process that accounts for holding costs, market ceilings, and diminishing returns.
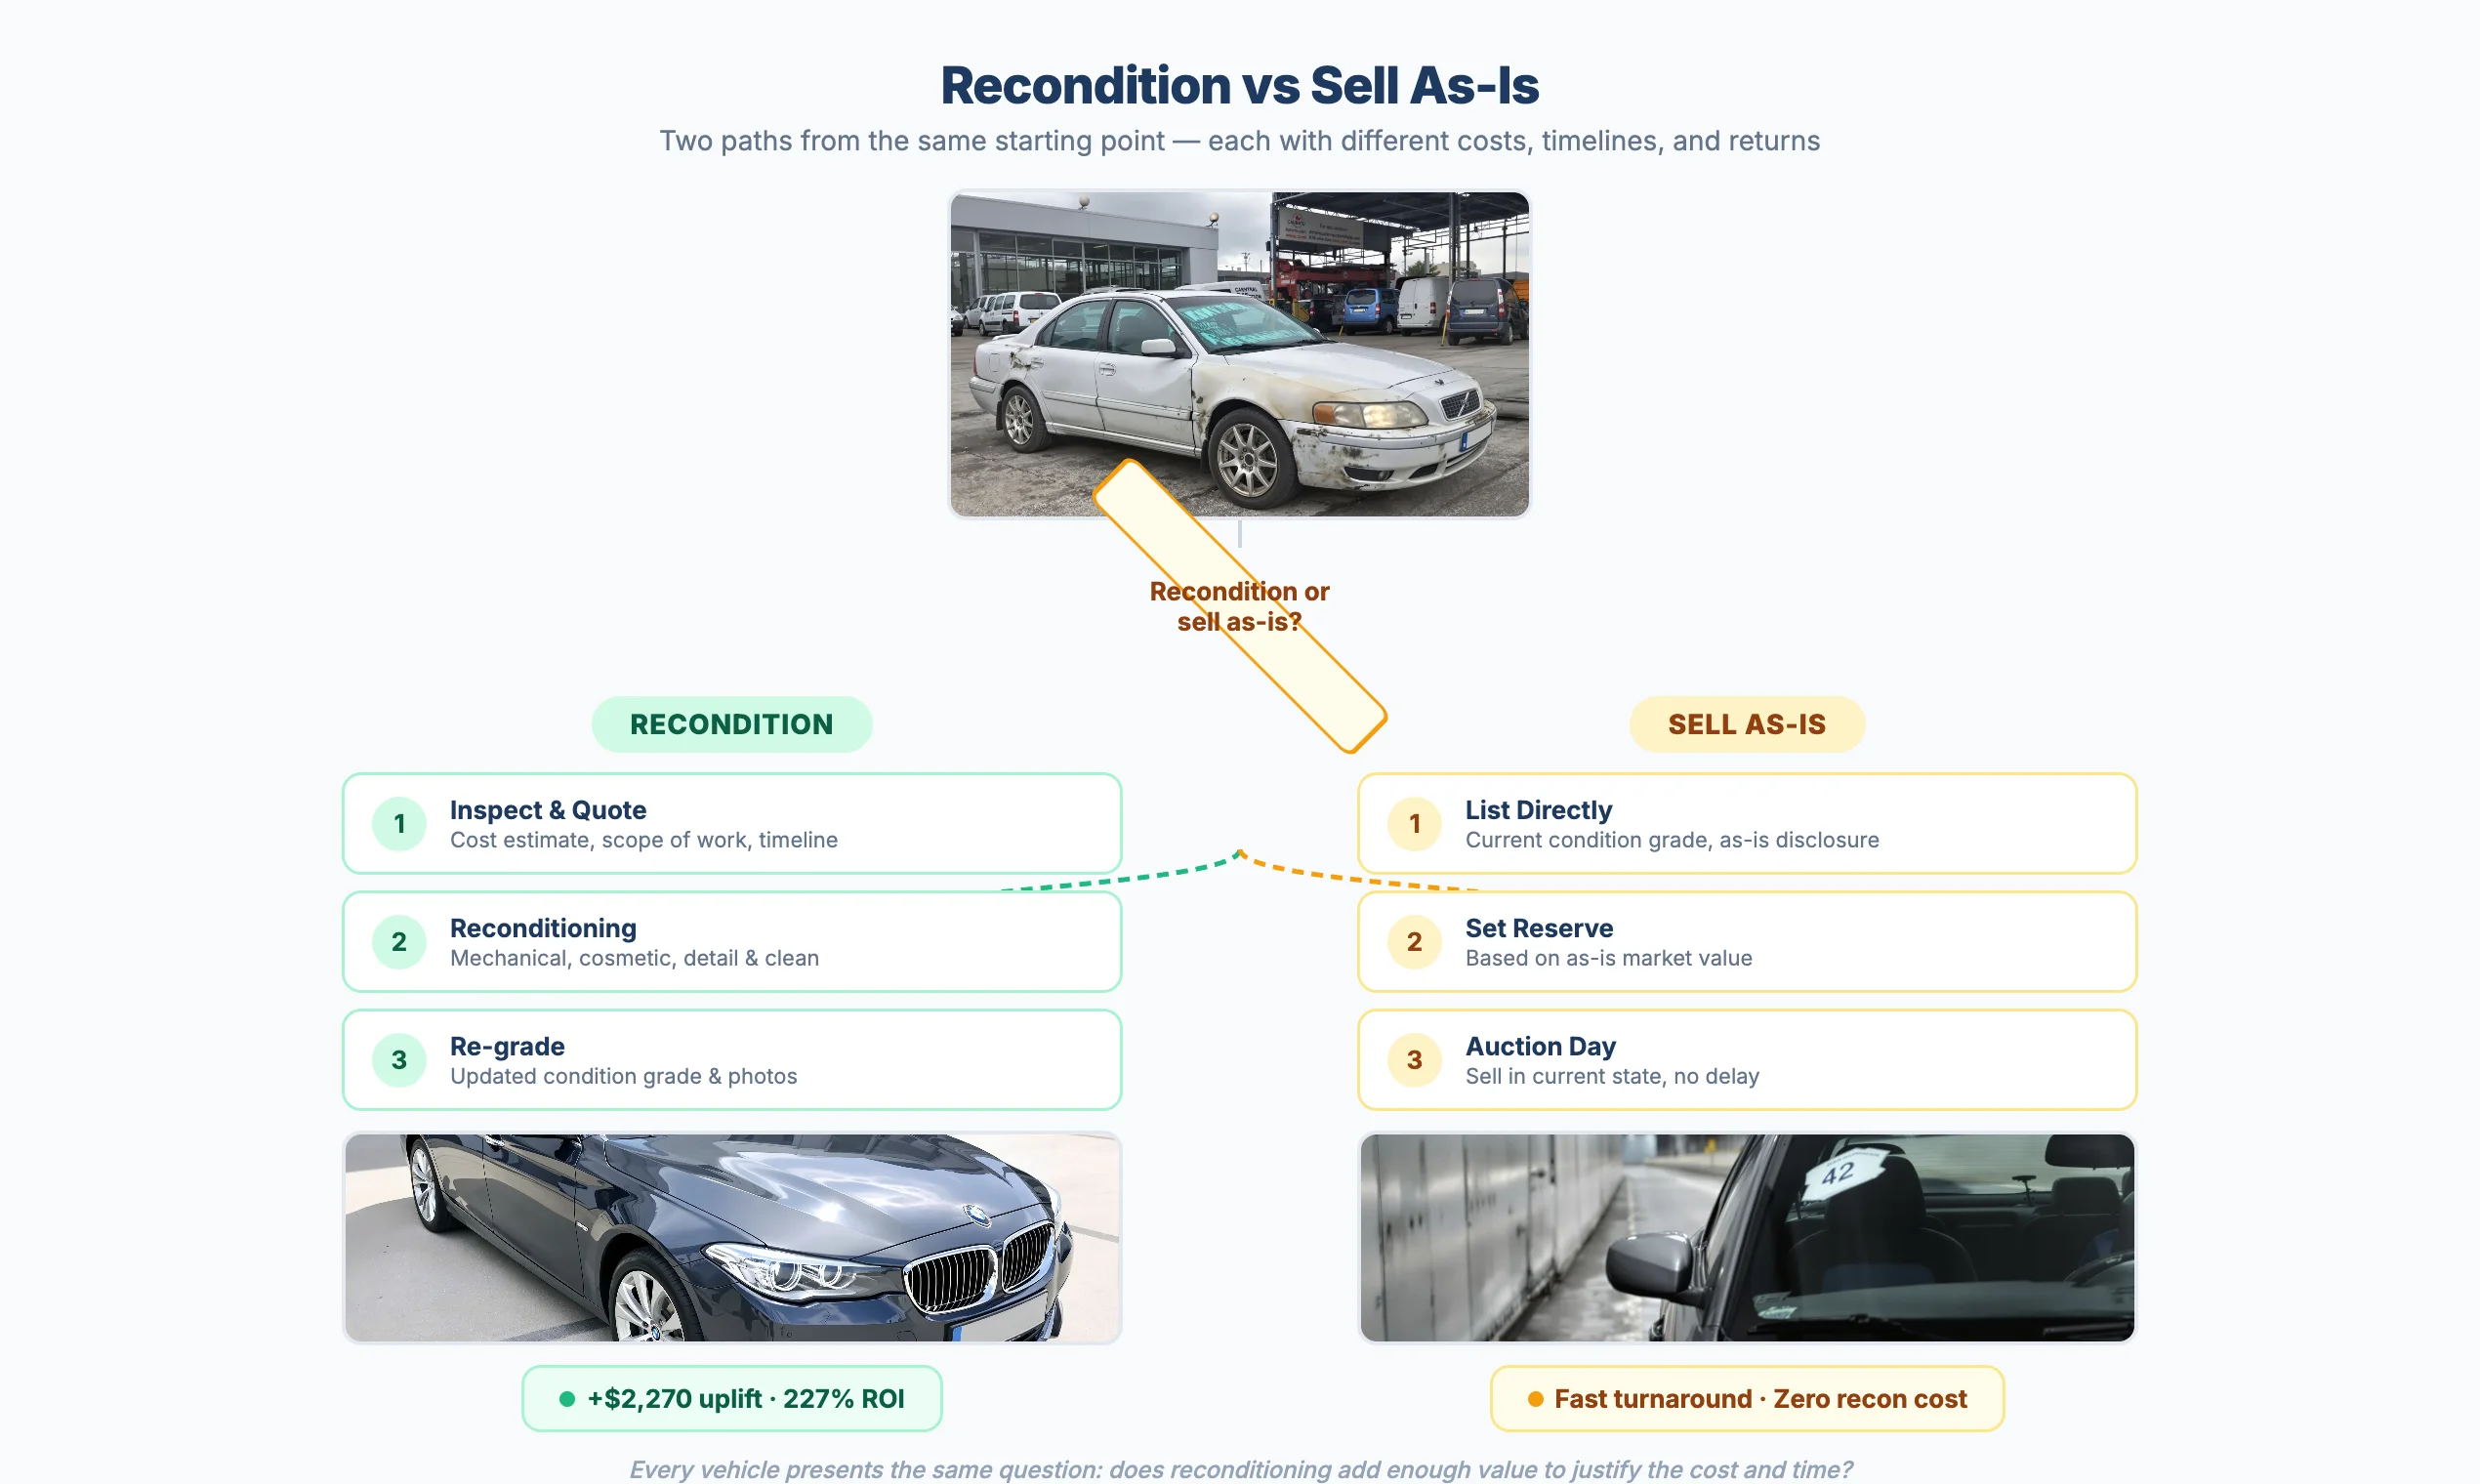 Every vehicle presents the same question: does reconditioning add enough value to justify the cost and time?
What Reconditioning Costs — Category Benchmarks
Reconditioning costs vary widely by category, and each category carries a different ROI profile. Mechanical repairs on safety-critical items (brakes, suspension) recover their cost more reliably than drivetrain overhauls. Cosmetic work drives buyer confidence at low cost. Full resprays rarely pay back. The table below provides 2025 benchmarks for independent dealer operations in the US market.
| Category | Common Repairs | Typical Cost Range | ROI Potential |
|---|---|---|---|
| Mechanical | Brakes, suspension, HVAC, exhaust | $150–$5,000+ | High for safety items; diminishing on drivetrain |
| Cosmetic | PDR, scratch repair, bumper repair, wheel refurb | $75–$1,500 | High — visible improvements drive buyer confidence |
| Paint | Touch-up, panel respray, full respray | $50–$5,000 | Moderate touch-up; low for full respray |
| Detailing | Interior deep clean, polish, odor treatment, headlights | $75–$300 | Highest ROI per dollar of any category |
| Glass and Body | Windshield, body panel replacement | $250–$2,500 | Moderate — required for retail, less for wholesale |
| Tires and Wheels | Tire replacement, alignment | $75–$200/tire + $75–$150 alignment | Moderate — baseline safety expectation |
The cost ranges above reflect parts and labor at independent shops. Franchise dealer service departments typically charge 30–50% more. In-house reconditioning operations reduce per-vehicle costs but require capital investment in facilities, equipment, and technicians.
For a detailed breakdown of each category — including sub-item pricing, regional variations across US, UK, and German markets, and a pre-bid budgeting checklist — see Reconditioning Cost Categories.
How to Calculate Reconditioning ROI
The core formula is straightforward: ROI = (Price Uplift − Reconditioning Cost) / Reconditioning Cost × 100. A positive result means the reconditioning generated more value than it consumed. A negative result means the vehicle would have been more profitable sold as-is.
The formula only works when it captures the full cost. Reconditioning cost is not just parts and labor — it includes holding costs for every day the vehicle sits on your lot waiting for parts, waiting for a bay, or waiting for the work to complete. At $37–$50 per day in floor plan interest, insurance, depreciation, and opportunity cost, a 10-day reconditioning cycle adds $370–$500 to the real cost of the work.
Estimate as-is wholesale value
Use the vehicle's condition report, condition grade, and comparable auction results to establish what the vehicle would sell for today with no reconditioning.
Estimate post-reconditioning value
Research comparable vehicles in reconditioned condition. Factor in the specific repairs you plan to perform and how they affect the condition grade and buyer perception.
Calculate price uplift
Subtract the as-is value from the post-reconditioning value. This is the gross value created by the work.
Total all reconditioning costs
Add parts, labor, sublet work, and any materials. Include shop supplies and diagnostic fees. Use actual quotes, not estimates.
Add holding costs
Multiply your daily holding cost ($37–$50/day) by the estimated reconditioning cycle time in days. Include weekends and any parts-waiting delays.
Compute ROI
Apply the formula: (Price Uplift − Total Cost) / Total Cost × 100. If the result is below your minimum acceptable ROI threshold (typically 30–50%), sell as-is.
Model your maximum bid before the auction using the Break-Even / Max Bid Calculator, and calculate your full acquisition cost including reconditioning with the Landed Cost Calculator. For a complete breakdown of auction fees that layer on top of reconditioning costs, see the fee guide. Dealers sourcing cross-border should also factor in transport and duty when sizing the reconditioning budget.
Three Worked Examples
The following three scenarios illustrate how the same reconditioning logic produces dramatically different outcomes depending on the vehicle’s value, the scope of work, and the cycle time. All figures use $40/day as the holding cost baseline.
| Factor | 2022 Toyota Camry | 2017 Ford Escape | 2015 Chevrolet Malibu |
|---|---|---|---|
| As-Is Wholesale Value | $18,500 | $10,200 | $6,800 |
| Reconditioning Spend | $650 | $1,800 | $3,200 |
| Work Performed | Detail, PDR, headlight restore | Detail, brakes, 2 tires, AC compressor | Transmission, 4 tires, brakes, detail, minor body |
| Holding Days | 2 days | 8 days | 14 days |
| Holding Cost (~$40/day) | $80 | $320 | $560 |
| Total Cost | $730 | $2,120 | $3,760 |
| Post-Recon Sale Price | $19,800 | $11,800 | $8,500 |
| Price Uplift | $1,300 | $1,600 | $1,700 |
| Net Gain / (Loss) | +$570 | −$520 | −$2,060 |
| ROI | +78% | −25% | −55% |
The Camry succeeded because the work was cosmetic, fast (two days), and inexpensive relative to the vehicle’s value. A $650 investment in detailing, paintless dent repair, and headlight restoration generated $1,300 in price uplift — a 78% ROI after holding costs.
The Escape failed despite generating $1,600 in uplift. The AC compressor repair consumed $900 in parts and labor, and the eight-day cycle added $320 in holding costs. Total cost of $2,120 exceeded the $1,600 uplift by $520. Selling as-is at $10,200 would have been more profitable than selling at $11,800 after spending $2,120.
The Malibu illustrates value destruction. A $3,200 reconditioning bill (dominated by a transmission replacement) plus 14 days of holding costs ($560) totaled $3,760 — more than double the $1,700 price uplift. The vehicle’s market ceiling prevented the reconditioning from paying back.
Platform Condition Grades
Platform grading systems translate vehicle condition into standardized scores that directly affect sale prices. A one-grade improvement through reconditioning can shift the hammer price by hundreds or thousands of dollars — but only if the grading system captures the work you performed.
| Platform | Scale | Top Grade | Mid Grade | Lowest Grade | Notes |
|---|---|---|---|---|---|
| Manheim | 1.0–5.0 | 5.0 (like new) | 3.0–3.5 (average) | 1.0 (rough) | 0.5-point increments; most wholesale units grade 2.5–3.5 |
| ADESA / OPENLANE | 1.0–5.0 | 5.0 | 3.0 | 1.0 | NAAA-aligned scale; used across OPENLANE digital channels |
| BCA (Europe) | 1–5 | 1 (as new) | 3 (average) | 5 (poor) | Inverted scale — Grade 1 is the highest quality |
| ACV Auctions | 1.0–5.0 | 5.0 | 3.0 | 1.0 | Digital-native inspections; 360-degree photo integration |
BCA’s inverted scale (Grade 1 = highest quality) is a common source of confusion for dealers accustomed to North American platforms where 5.0 is the top grade. When sourcing cross-platform, verify which direction the scale runs before interpreting grades.
The NAAA standard requires disclosure of any single defect costing $800 or more to repair or replace. This threshold directly affects reconditioning strategy: a repair that brings a vehicle above the $800 disclosure line removes a mandatory announcement that suppresses bidding activity. Conversely, spending $600 on a repair that does not change the disclosure status may not produce a measurable price uplift. For details on how disclosures trigger post-sale disputes, see the arbitration claims guide.
Decision Framework — Recondition vs. Sell As-Is
Not every vehicle warrants reconditioning. The decision depends on vehicle age, market demand, damage type, and your operational capacity. The matrix below maps common vehicle profiles to the appropriate strategy. For a deeper dive into the decision process — including a four-quadrant framework, category-specific ROI analysis, and a 10-point quick assessment checklist — see When to Recondition vs. Sell As-Is.
| Vehicle Profile | Reconditioning Strategy | Rationale |
|---|---|---|
| Late-model (0–3 years), low mileage, cosmetic-only damage | Recondition — cosmetic and detail only | High base value supports ROI; visible improvements shift condition grade and buyer confidence |
| Mid-age (4–7 years), moderate mileage, safety items needed | Recondition — safety and cosmetic | Brakes, tires, and detailing bring the vehicle to retail-ready condition; avoid drivetrain work |
| Older (8+ years), high mileage, mechanical issues | Sell as-is at wholesale | Market ceiling limits price uplift; reconditioning spend unlikely to recover |
| Any age, frame or structural damage | Sell as-is or to salvage buyers | Structural repairs rarely recover cost; disclosure requirements persist even after repair |
| High-demand segment (trucks, SUVs, hybrids) | Recondition — moderate scope | Strong demand absorbs reconditioning cost; price uplift potential higher than sedans |
| Low-demand or oversupplied segment | Sell as-is — minimize exposure | Weak market reduces price uplift potential; holding costs compound during slow sale cycles |
The auction type also influences the decision. Vehicles sold through timed online auctions rely entirely on the condition report and photos to communicate condition — making cosmetic reconditioning and detailing more impactful than at live auctions where buyers inspect in person. At live auctions, mechanical soundness carries more weight because buyers can hear, feel, and test-drive the vehicle.
Diminishing Returns and the Reconditioning Ceiling
Every vehicle segment has a market price cap — the maximum a buyer will pay regardless of condition. A 2015 midsize sedan in flawless condition still sells within a predictable price band. Reconditioning beyond the point where the vehicle reaches that ceiling generates zero additional return.
The Manheim $2.27 return statistic is an average across all vehicles in its certified reconditioning program. The top 20% of vehicles in that program drive most of the returns, while the bottom 20% likely break even or lose money. Averages mask the distribution, and the distribution is where reconditioning decisions are made.
Five signs you have hit the reconditioning ceiling:
- The vehicle’s book value has not changed after the most recent repair
- Comparable auction results show a tight price band regardless of condition differences
- The reconditioning spend has exceeded 10% of the vehicle’s as-is value
- The vehicle has been on the lot for more than seven days waiting for parts or a bay
- The scope of work has expanded beyond the original estimate more than once
Reconditioning Speed — Why Cycle Time Matters
The industry average reconditioning cycle runs approximately 10 days from acquisition to sale-ready. Operations using dedicated reconditioning workflow software achieve cycle times as low as 2.5 days. That 7.5-day difference translates directly into holding costs: at $40/day, the gap between a 10-day cycle and a 2.5-day cycle is $300 per vehicle.
Across 50 vehicles per month, compressing cycle time from 10 days to 2.5 days saves $15,000 per month — $180,000 annually — in holding costs alone. Model your specific floor plan costs with the Floorplan Interest Cost Calculator. The remarketing advantage compounds further because faster cycle times mean faster inventory turns, earlier cash recovery, and the ability to process more vehicles through the same bay capacity.
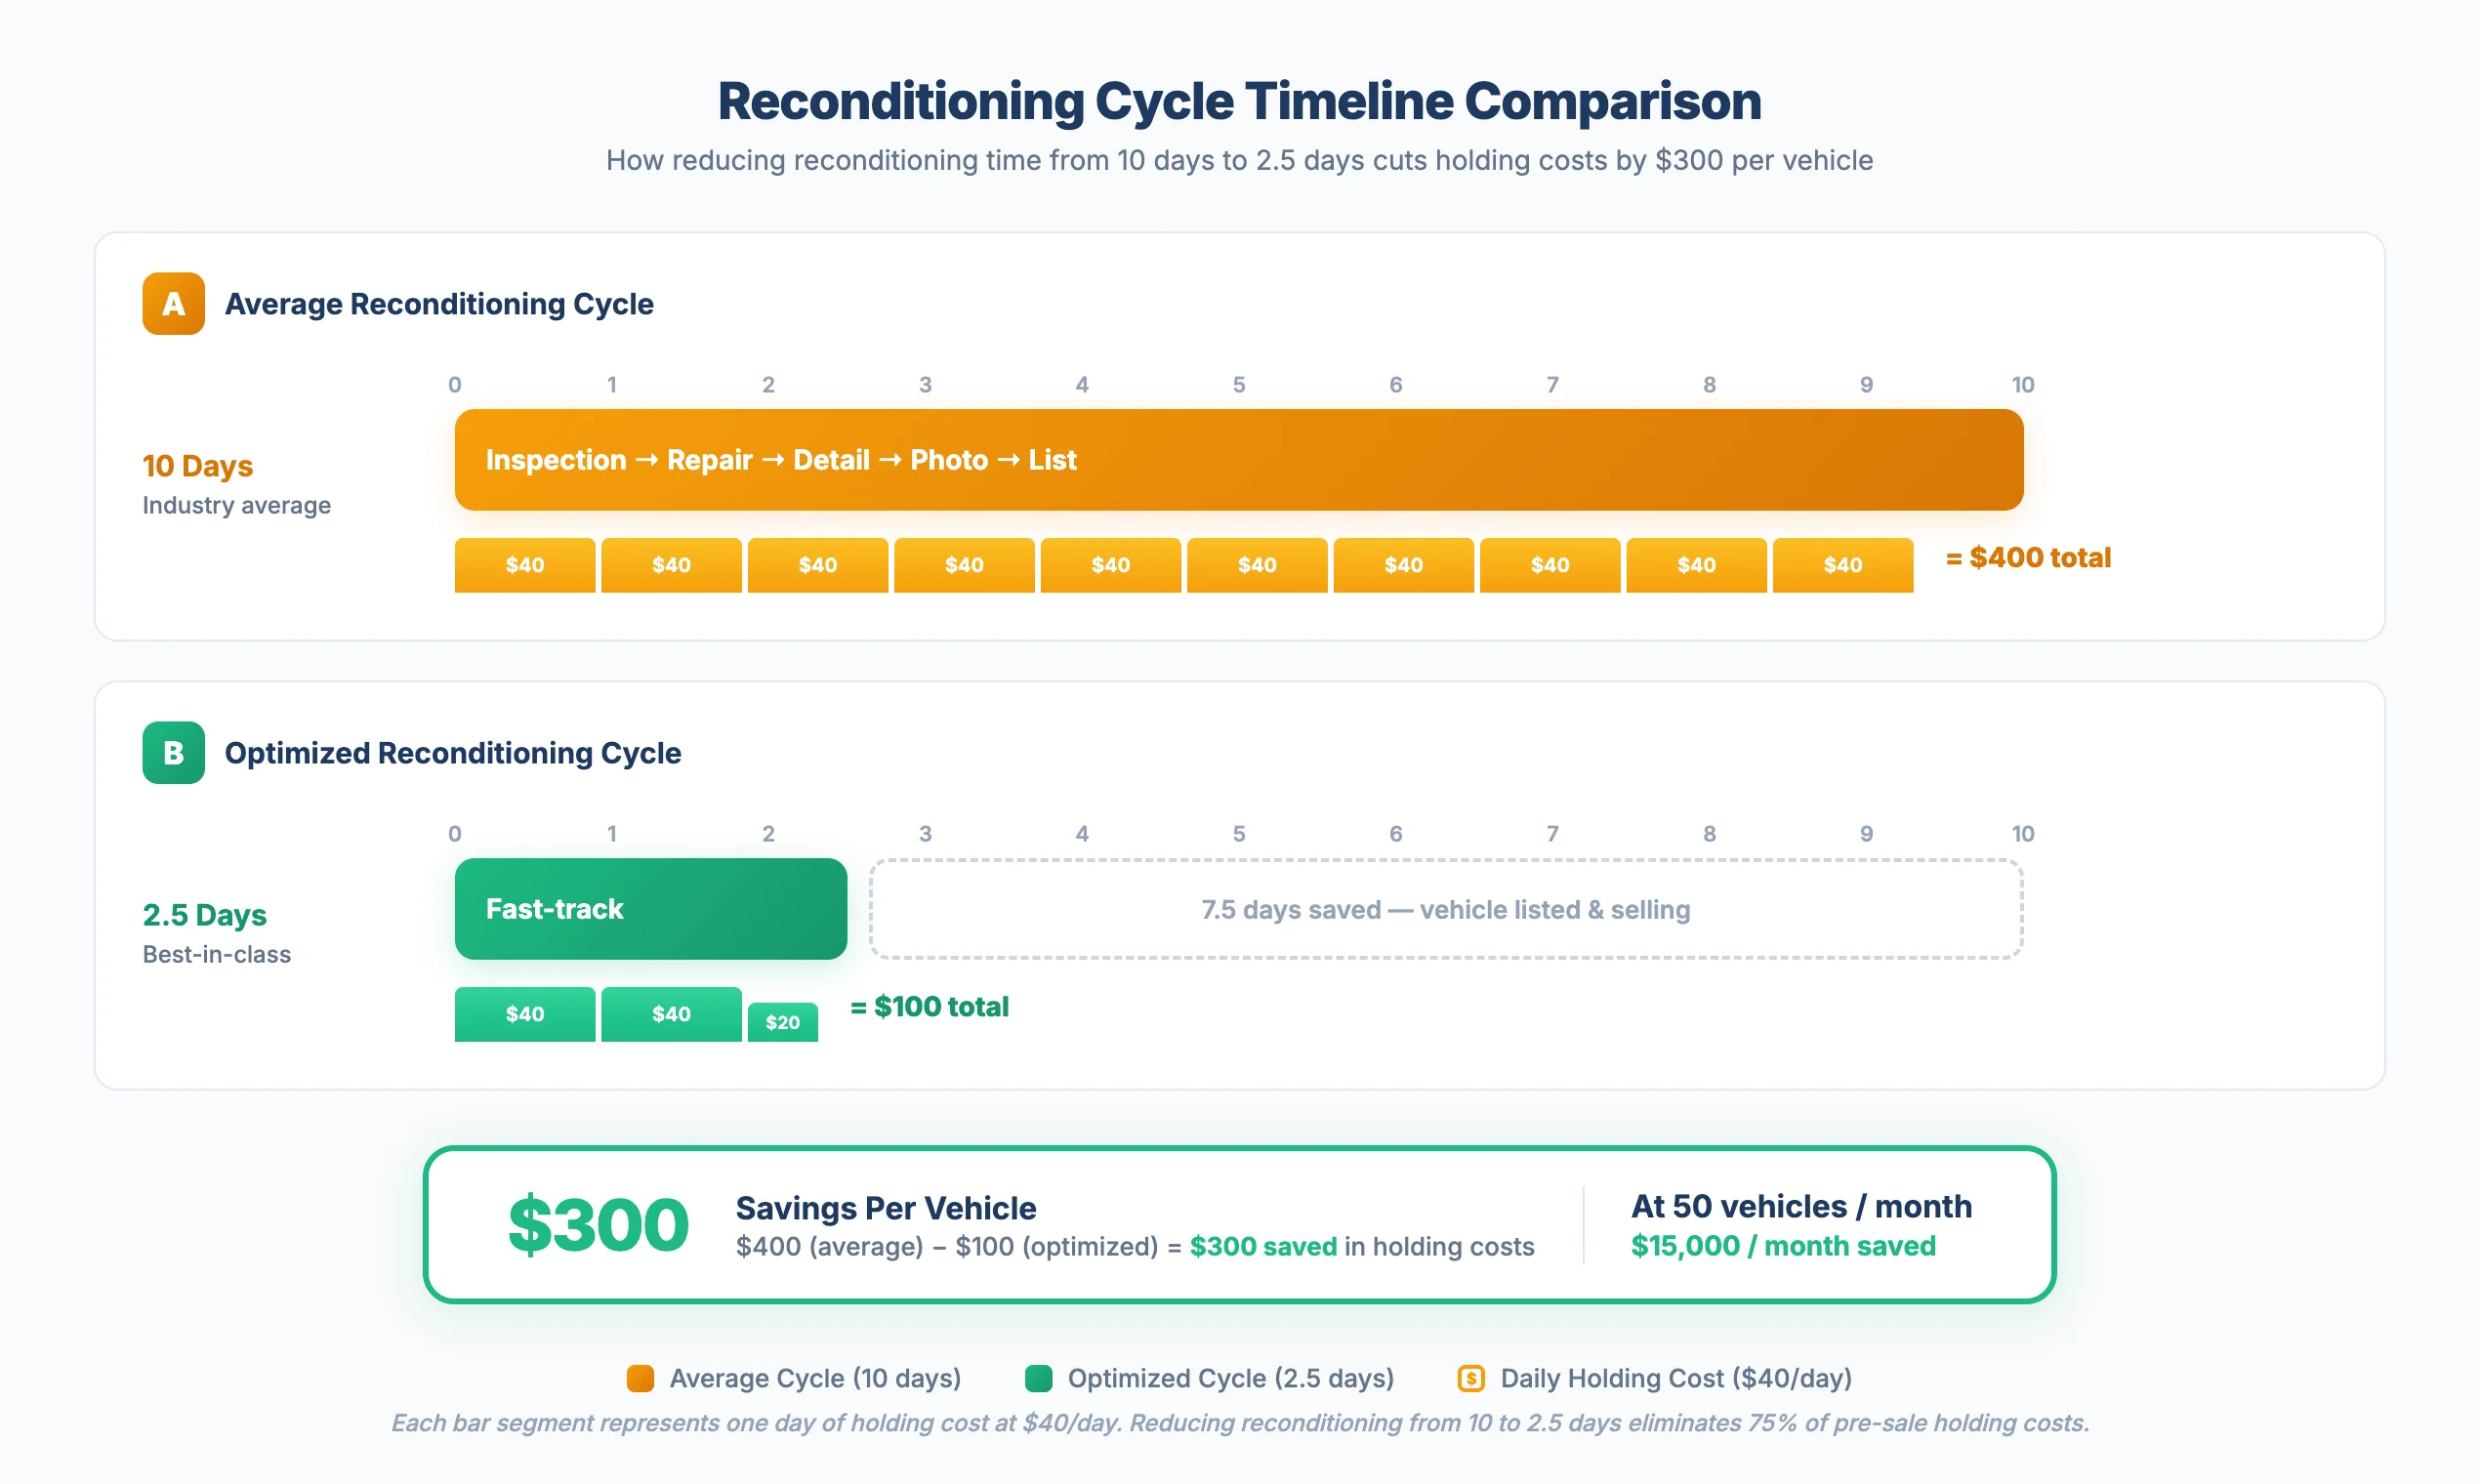 Reducing reconditioning cycle time from 10 days to 2.5 days saves $300 per vehicle in holding costs.
Five strategies to reduce reconditioning cycle time:
- Pre-approve common repairs — Set standing authorizations for work under $500 to eliminate approval bottlenecks
- Stock fast-moving parts — Maintain inventory of brakes, filters, wipers, bulbs, and common wear items to avoid parts-waiting delays
- Batch similar work — Group vehicles by repair type to keep technicians focused and reduce setup time between jobs
- Use workflow software — Track each vehicle through a stage-gate process (inspect, approve, repair, quality check, photo, list) with time targets per stage
- Set a hard cycle-time target — Measure and report cycle time weekly; investigate any vehicle that exceeds five days
Pre-Reconditioning Decision Checklist
Use this checklist before committing reconditioning spend on any vehicle. Complete all items to confirm that reconditioning is the value-maximizing strategy for the specific unit.
Pre-Reconditioning Decision Checklist
0 of 10 completedFrequently Asked Questions
What is the average ROI on vehicle reconditioning?
Manheim’s certified reconditioning program reports an average return of $2.27 for every $1 spent — a 127% ROI. However, this figure reflects a curated program with professional inspections and controlled repair scopes. Independent dealer reconditioning ROI varies widely by vehicle age, repair category, and cycle time. Detailing and cosmetic work consistently deliver the highest returns (100–300%+), while drivetrain and structural repairs frequently produce negative ROI.
When should I sell a vehicle as-is instead of reconditioning?
Sell as-is when reconditioning costs exceed 10% of the vehicle’s wholesale value, when the vehicle has frame or structural damage, when the market segment is oversupplied, or when the estimated repair scope is uncertain. Vehicles older than eight years with high mileage and mechanical issues are also strong as-is candidates because their market ceiling limits the price uplift reconditioning can generate.
How much does reconditioning cost per vehicle?
Reconditioning costs range from $75 for basic detailing to $5,000+ for major mechanical or paint work. The average across independent dealer operations falls between $500 and $2,000 per vehicle, depending on scope. Detailing runs $75–$300, cosmetic smart repair $75–$1,500, mechanical work $150–$5,000+, and tire replacement $75–$200 per tire plus $75–$150 for alignment.
How do holding costs affect reconditioning profitability?
Holding costs of $37–$50 per day — covering floor plan interest, insurance, depreciation, and opportunity cost — accumulate for every day a vehicle remains on the lot during reconditioning. A 10-day cycle adds $370–$500 to the true cost of reconditioning. This hidden cost is the single most common reason that reconditioning shows a positive gross return but a negative net return. Compressing cycle time from 10 days to 2.5 days saves $300 per vehicle.
What is the NAAA $800 disclosure threshold?
The National Auto Auction Association requires sellers to disclose any single mechanical defect costing $800 or more to repair or replace. This threshold determines what must be announced at sale and what triggers arbitration eligibility on Green and Yellow Light vehicles. Reconditioning that addresses a defect above the $800 line removes a mandatory disclosure — potentially increasing bidding activity and reserve price realization. Defects below $800 do not require announcement under NAAA policy.
Conclusion
Reconditioning is a profit lever — not a default step. The vehicles that generate strong reconditioning ROI share three traits: the work is cosmetic or safety-focused, the cycle time is short, and the total spend stays under 10% of the vehicle’s as-is value. Vehicles that fall outside those parameters are more profitable sold as-is.
Before bidding, model your reconditioning scenario with the Break-Even / Max Bid Calculator to set a maximum bid that accounts for planned reconditioning costs. After the sale, use the Net Proceeds Calculator to verify that the actual reconditioning spend and holding time produced the margin you projected. Use the Reconditioning ROI Calculator to automate this analysis for any vehicle.