
Why Channel Optimization Separates High-Recovery Remarketing
NAAA members sold 7.6 million vehicles in 2024, generating $105 billion in gross wholesale sales at a 61.3% conversion rate. Professional remarketers — OEM programs, captive finance arms, bank asset disposal units, and leasing remarketing teams — manage the sell-side of this volume. The central challenge is selling at scale across multiple channels while maximizing net recovery on every vehicle in the portfolio.
A multi-channel remarketing approach yields approximately $4,000 per vehicle in combined savings compared to single-channel dependency. Cross-border remarketing generates an additional EUR 3,000 per vehicle when market arbitrage conditions exist. These figures are not theoretical — they reflect measured outcomes from operations that systematically match vehicle segments to the channels where buyer demand and competitive bidding produce the highest net recovery. The Platform Directory provides a starting point for identifying channels matched to your portfolio segments and geographic reach.
 A structured multi-channel approach yields approximately $4,000 per vehicle in combined savings versus single-channel dependency.
The 6-Step Multi-Channel Remarketing Workflow
The following workflow covers the full remarketing cycle, from portfolio assessment through recovery optimization. Each step feeds into the next. The final step — feeding recovery data back into channel allocation — is where compound gains emerge over successive disposition cycles.
Assess vehicle portfolio
Classify every vehicle by age, mileage, condition grade, residual value, and vehicle type (ICE, EV, LCV). Vehicles with condition grades sell 3x more often than ungraded inventory. Use condition report data to separate vehicles into value tiers that determine downstream channel routing and reserve strategies.
Segment by condition and value
Create 3–4 segments: premium (high-residual, low-mileage, clean title), standard (average condition, moderate mileage), economy (high-mileage, cosmetic damage, older model years), and specialty (EVs, commercial vehicles, damaged/salvage). Each segment routes to different channels with different reserve strategies and recovery targets.
Select channels per segment
Map each segment to 1–3 channels based on recovery potential and cycle time. Retail channels yield approximately $1,000+ more than wholesale after fees but take 30–40 days. Auction channels close in 15–25 days. Employee and direct sales generate $500–$900 per unit above wholesale. Match urgency and volume to the channel that maximizes net recovery within your target timeframe.
Execute listings with data-driven pricing
Set reserve prices using AI-assisted valuation tools — pricing accuracy has improved from 75% to 87%. Include comprehensive condition reports with 20+ photos per vehicle. Use bulk listing tools and API integrations to manage volume efficiently. Accurate reserves reduce both overpricing (which suppresses bids) and underpricing (which leaves recovery on the table).
Monitor performance across channels
Track conversion rates, days-to-sale, and net recovery by channel and segment weekly. Benchmark against the 61.3% industry average conversion rate. Vehicles not selling in the first auction window: reprice 5–10% down and reallocate to an alternative channel within seven days. Extended holding increases depreciation and storage costs that erode net recovery.
Optimize the channel mix quarterly
Feed recovery data back into channel allocation decisions. Shift volume toward higher-recovery channels per segment. Target 85–95% of book value as the net recovery benchmark. The optimization loop is where compound gains emerge — each cycle's data improves the next cycle's channel mix, reserve accuracy, and segment routing.
Remarketing Channel Comparison
| Channel | Recovery vs. Wholesale | Avg Days-to-Sale | Best For | Trade-Off |
|---|---|---|---|---|
| B2B Auction (Physical) | Baseline | 15–25 days | Volume disposal, fleet/lease returns | Limited buyer reach if in-lane only |
| B2B Auction (Digital/Timed) | +2–5% vs physical | 10–20 days | Wide geographic reach, all segments | Requires comprehensive condition reports |
| Retail Channel (Direct) | +$1,000+ vs wholesale | 30–40 days | Premium, low-mileage vehicles | Longer cycle, higher recon cost |
| Employee/Direct Sales | +$500–$900 vs wholesale | Variable | Clean, moderate-mileage units | Limited volume capacity |
| Cross-Border Export | +EUR 3,000 per vehicle | 20–35 days | Market arbitrage, surplus models | Compliance complexity, transport cost |
| Salvage/As-Is | −15–30% vs wholesale | 5–10 days | Damaged, high-mileage, uneconomic to recondition | Lowest recovery, fastest liquidation |
No single channel is optimal for all vehicles. The goal is matching each portfolio segment to the channel that maximizes net recovery within the target timeframe. Premium off-lease vehicles routed to retail channels recover $1,000+ more per unit than wholesale, but the 30–40 day cycle is not viable for high-volume disposal windows.
Damaged vehicles clear fastest through salvage channels at a 15–30% discount. Cross-border remarketing generates EUR 3,000 per vehicle when market arbitrage exists, but compliance and transport costs must be factored into the net recovery calculation. For cross-border logistics and compliance details, see the Cross-Border Buying Guide.
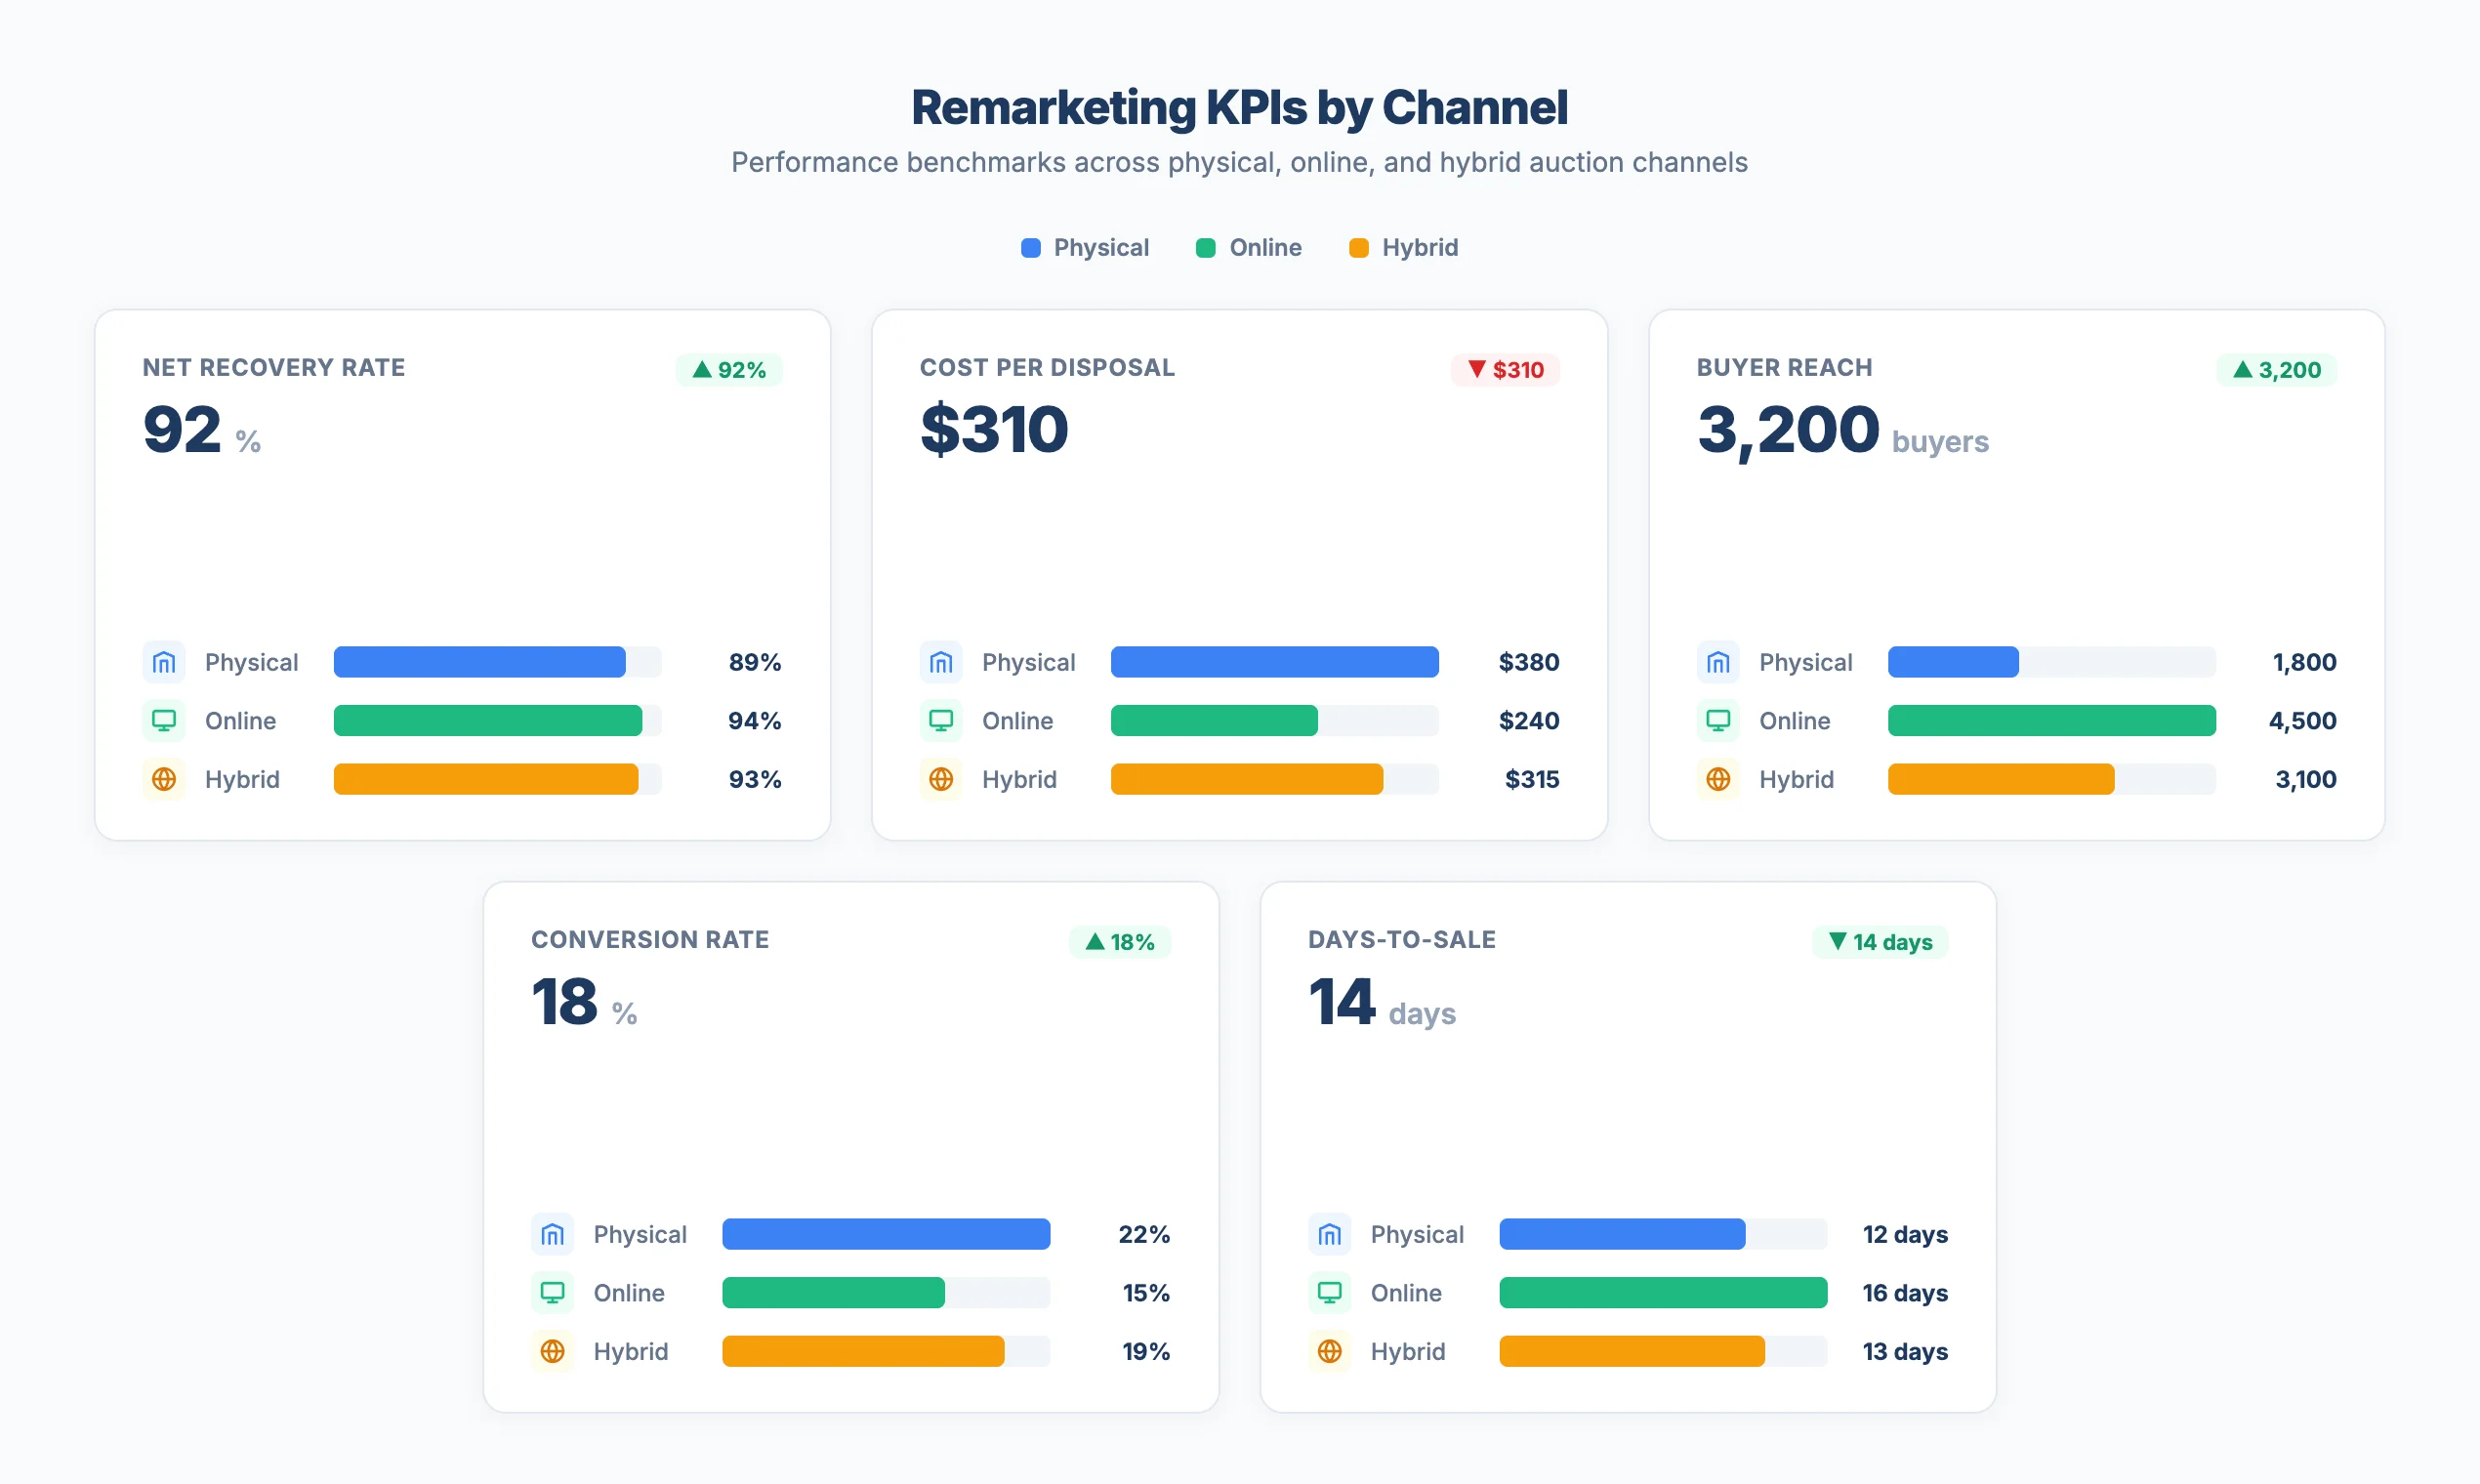
Remarketing KPI Benchmarks
Five KPIs form a closed feedback loop for remarketing performance. Track each one monthly by channel and vehicle segment to identify trends before they compress recovery across the portfolio.
| KPI | Benchmark | Why It Matters | How to Track |
|---|---|---|---|
| Net Recovery Rate | 85–95% of book value | Primary measure of remarketing effectiveness; captures pricing, channel selection, and cost management | (Net proceeds / book value) × 100; segment by vehicle type and channel |
| Cost per Disposal | $340–$1,350 per vehicle | Must subtract from gross recovery to measure true net return | Sum of seller commission + recon + transport + condition report + storage per vehicle |
| Buyer Reach | 35 mi (in-lane) / 95 mi (simulcast) / 200+ mi (digital) | Wider reach correlates with higher hammer prices and faster conversion | Track average buyer distance by listing format |
| Conversion Rate | 61.3% industry avg (NAAA) | Below-average conversion signals pricing misalignment or inadequate presentation | Vehicles sold / vehicles listed per auction cycle; segment by channel |
| Average Days-to-Sale | 15–25 days (auction) / 30–40 (retail) | Extended holding increases depreciation and storage costs that erode net recovery | Date sold minus date listed; track separately by channel and segment |
These five metrics connect directly: net recovery rate measures overall remarketing effectiveness, cost per disposal ensures accurate net calculations, buyer reach tracks competitive dynamics by listing format, conversion rate signals pricing alignment, and days-to-sale measures operational speed. Use the Net Proceeds Calculator to model how changes in any single cost line affect net recovery before adjusting reserves or reallocating volume.
 Five KPIs that separate high-recovery remarketing operations from reactive disposition.
Platform Feature Comparison for Remarketing
| Capability | OPENLANE | BCA | Autorola |
|---|---|---|---|
| Annual Volume | 1.4M vehicles, $27B GMV | 1M+ vehicles/year | 70,000+ active buyers |
| OEM Programs | 40+ OEM remarketing programs | Major OEM partnerships across Europe | OEM and leasing company programs |
| Geographic Reach | North America + Europe | 10 European countries, fully online | 70,000+ buyers across Europe |
| Auction Format | Digital-first, timed + simulcast | Fully online | 100% online timed auctions |
| Remarketing Analytics | Enterprise reporting, AI pricing | Market data integration | Real-time bidding analytics |
| Cross-Border Support | Multi-country operations | Pan-European logistics | EUR 3,000 extra per vehicle via data-driven country selection |
Using AI and Data-Driven Pricing
AI-assisted pricing accuracy has improved from 75% to 87%. For remarketing operations managing thousands of vehicles per quarter, this translates into more accurate reserve-setting and higher conversion rates. The improvement reduces both overpricing — which suppresses bids and extends days-to-sale — and underpricing — which leaves recovery on the table.
Four areas where data-driven pricing delivers measurable impact:
- Dynamic reserve optimization — AI models adjust reserve prices based on real-time market data, comparable sales, and buyer demand signals per vehicle segment
- Segment-level pricing models — separate valuation models for ICE, EV, LCV, and specialty vehicles capture the distinct depreciation curves and buyer behavior patterns for each type
- Conversion prediction — predictive models flag vehicles likely to fail their first auction window, enabling proactive repricing or channel reallocation before the listing expires
- Cross-border arbitrage detection — algorithms identify vehicles where demand-supply imbalances across markets create recovery premiums that exceed compliance and transport costs
The EV Remarketing Challenge
EVs retain approximately 38% of their original value after three years, compared to 57% for ICE vehicles — a 19-percentage-point gap that directly compresses recovery rates. EV lease returns are surging as three-year terms from 2023 reach maturity. Remarketing operations applying ICE-era assumptions to EV disposition will see portfolio-wide recovery rates decline as EV volume grows as a share of total returns.
Five adjustments for EV remarketing:
- Separate EV recovery benchmarks — apply the 38% three-year retention baseline rather than the 57% ICE standard when forecasting residual values and setting recovery targets
- Document battery state-of-health (SOH) — verified SOH data from the OEM diagnostic system or a third-party battery assessment gives buyers the confidence to bid competitively
- Target EV-specialist buyer networks — platforms with concentrated EV buyer pools generate more competitive bidding than generalist channels where EV demand is dispersed
- Consider earlier lifecycle disposal — EV depreciation curves are steeper in years two and three; disposal at 24 months rather than 36 captures residual value before the steepest decline
- Track EV KPIs separately — blending EV and ICE metrics in a single dashboard masks the performance gap; separate tracking surfaces problems that aggregate numbers hide
Common Mistakes That Erode Recovery
-
Single-channel dependency. Relying on one platform limits buyer competition and eliminates the ability to match vehicle segments to channel strengths. A multi-channel approach yields approximately $4,000 per vehicle in combined savings. Single-channel operations absorb this as a hidden cost on every transaction — invisible in aggregate metrics but compounding across the portfolio.
-
Ignoring condition grading. Vehicles with condition grades sell 3x more often than ungraded inventory. Without comprehensive condition reports, buyer reach contracts from 200+ miles (digital) to 35 miles (in-lane only). The $50–$150 cost of a condition report is recovered many times over through wider buyer reach, higher hammer prices, and faster conversion.
-
Treating EVs and ICE identically. Blending EV and ICE metrics in a single recovery rate masks underperformance. A portfolio may show 90% overall recovery while EVs sit at 70% and drag the aggregate down as EV volume grows. Separate segmentation, pricing models, and KPI tracking are required to manage EV disposition effectively.
-
No post-sale performance feedback loop. Aggregate metrics mask channel-specific and segment-specific problems. Without per-vehicle, per-channel tracking fed into the next allocation cycle, pricing errors and channel mismatches repeat indefinitely. The optimization loop (Step 6 of the workflow) is where compound gains emerge — skipping it turns every cycle into an isolated event rather than an input to the next.
Remarketing Platform Evaluation Checklist
Platform Features to Evaluate for Remarketing Operations
0 of 10 completedAny platform handling 30% or more of your disposition volume should meet at least seven of these 10 criteria. Platforms that fall short on analytics, condition reporting, or buyer network depth create risk that compounds across every vehicle listed. For a detailed comparison of platform capabilities across regions, see the Platform Selection Guide.
Channel Allocation Worksheet
For an interactive version that calculates net recovery automatically, use the Net Proceeds Calculator. Complete one worksheet per portfolio segment per disposition cycle to build the performance dataset that drives quarterly channel optimization.
Frequently Asked Questions
How many remarketing channels should a professional operation use?
Two to three channels per vehicle segment provide sufficient buyer competition without fragmenting volume. Spreading vehicles across too many platforms prevents qualification for volume-tier pricing. Consolidate enough volume per platform to unlock remarketing-level fee schedules, then use secondary channels for segments where the primary platform underperforms. A multi-channel approach yields approximately $4,000 per vehicle in combined savings compared to single-channel dependency.
What net recovery rate should remarketing teams target?
Target 85–95% of book value as the overall benchmark, segmented by vehicle type, condition grade, and channel. A 90% aggregate recovery rate that masks 70% EV recovery and 95% ICE recovery indicates a segment-specific problem, not healthy portfolio performance. Track net recovery monthly by segment and channel. The gap between aggregate and segment-level metrics is where undetected losses accumulate.
When does cross-border remarketing make financial sense?
Cross-border remarketing generates approximately EUR 3,000 per vehicle when market arbitrage conditions exist — meaning buyer demand and pricing in the destination market exceed the origin market by enough to offset compliance, documentation, and transport costs. Start with high-residual vehicles where the absolute recovery premium justifies the additional cycle time (20–35 days versus 15–25 for domestic auction). For logistics and compliance details, see the Cross-Border Buying Guide.
How should remarketing operations handle EV-specific disposition?
Treat EVs as a separate portfolio segment with dedicated recovery benchmarks. Use the 38% three-year retention baseline rather than the 57% ICE standard when setting residual expectations. Document battery state-of-health for every listing — missing SOH data suppresses bids and extends days-to-sale. Consider earlier lifecycle disposal at 24 months rather than 36 to capture residual value before the steepest depreciation. Track EV conversion rates, recovery rates, and days-to-sale separately from ICE metrics.
What is the role of AI in remarketing pricing?
AI pricing accuracy has improved from 75% to 87%, reducing both overpricing (which suppresses bids) and underpricing (which leaves recovery on the table). The impact is most measurable at scale — operations managing 500+ vehicles per month see the largest gains because pricing errors that affect 1–2% of vehicles compound significantly across volume. AI handles initial valuation and market comparison; remarketing professionals apply segment expertise and buyer behavior knowledge to set final reserves.
Putting the Playbook Into Practice
The six-step workflow, five KPI benchmarks, and channel comparison data in this playbook provide the structure for measurable remarketing performance. Start by segmenting your current portfolio using the channel allocation worksheet. Evaluate platforms against the 10-item checklist. Use the Platform Directory to compare options across regions and vehicle types, and run the Net Proceeds Calculator before setting reserves on every batch.
The margin gains come from consistency — segmenting vehicles into condition-and-value tiers, setting data-driven reserves, tracking per-vehicle recovery by channel and segment, and feeding results back into the next allocation cycle. Each cycle’s data improves the next. For a detailed breakdown of platform fee structures and how they affect net recovery, see the auction fees guide.